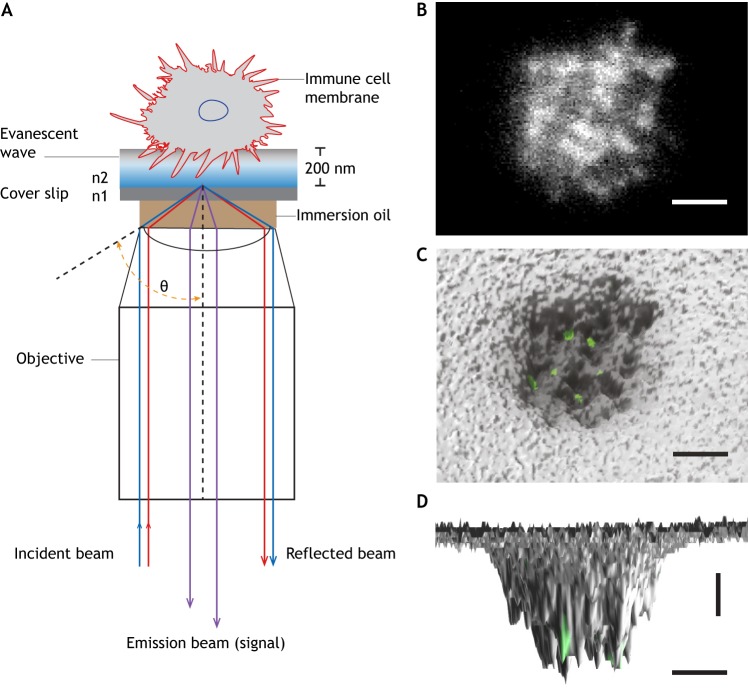
Fig. 1.
TIRF-based qDF imaging. (A) Schematic illustration of qDF imaging. An incident laser beam travels through the glass–cell interface at an angle (θ) with total internal reflection, (θ>θC=sin−1(n2/n1)). n1 and n2 are the refractive indices of glass and cell, respectively (n1>n2). The cell surface can be reconstructed by converting the cell membrane-labeled fluorescence into a 3D topographical map. (B) Footprints of a human neutrophil at the time of arrest on P-selectin and ICAM-1 in response to interleukin 8 (IL-8) at 6 dyn cm−2. Membrane was labeled with CellMask™ Deep Red. A top-view (C) and side-view (D) of the 3D topography of membrane (gray) was overlaid with high affinity integrin clusters (green) labeled with an antibody (mAb24). Images were taken in the Ley laboratory. Horizontal scale bars: 2 µm, vertical scale bar: 10 nm.

