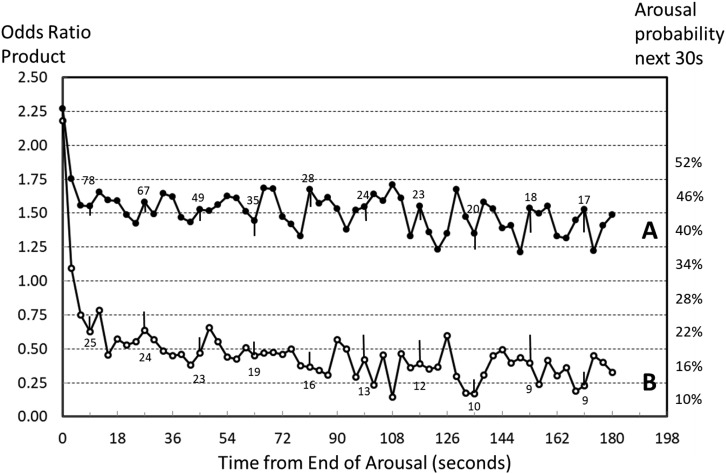
Figure 3. Average time course of all arousals in the two patients shown in Figure 2.
Numbers above each line are number of observations averaged at the time. Thus, the number “67” above line A at 27 seconds indicates that there were 67 arousals where no subsequent arousals occurred in the subsequent 27 seconds and, accordingly, data were available for averaging. Number of observations decreases as a function of time reflecting loss of observations due to secondary arousals in the intervening periods. Bars are standard error of the mean. Right ordinate values are a measure of arousability at different odds ratio product (ORP) levels (Younes M, Ostrowski M, Soiferman M, et al. Odds ratio product of sleep electroencephalography (EEG) as a continuous measure of sleep state. Sleep. 2015;28:641–654). Note the larger number of arousals with a minimum of 9 seconds available postarousal in patient A (78 versus 25), reflecting a higher arousal index, and the slower rate of decline in the numbers of available arousals in patient B, reflecting longer interarousal intervals.

