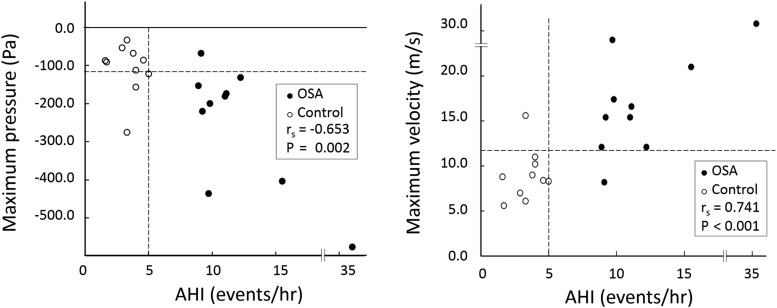
Figure 2. Distribution of AHI and maximum negative pressure and maximum velocity in the OSA and control groups.
Left: distribution of AHI and maximum negative pressure. The correlation of maximum negative pressure with AHI (rs) is shown (rs = −.653, P = .002). White markers indicate control data (AHI < 5 events/h); black markers, OSA data (AHI > 5 events/h). Right: distribution of AHI and maximum velocity. The correlation between maximum velocity and AHI (rs) was very strong (rs = .741, P < .001) and allowed the use of 12 m/s as a demarcation between the OSA and control groups. AHI = apnea-hypopnea index, OSA = obstructive sleep apnea.

