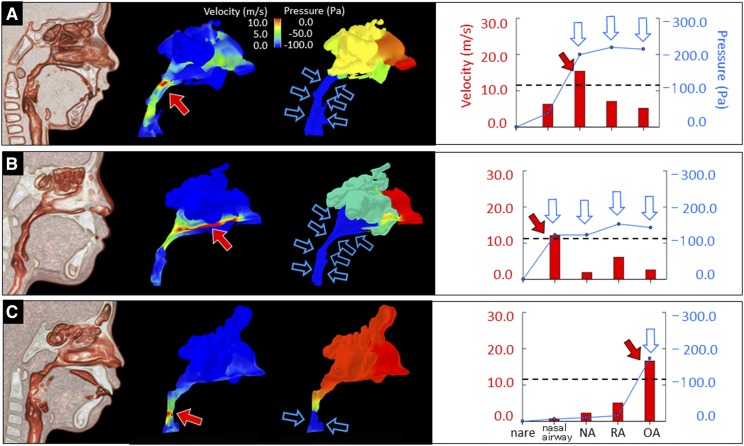
Figure 3. Relationship between pressure and velocity in children with OSA.
(A) In case 1, we simulated a high velocity (around 15.4 m/s, red arrow) and a large negative pressure in the NA (blue arrow). The negative pressures at the downstream sites (RA and OA) remained large; however, the velocities at these sites were low (blue arrows). (B) In case 2, we simulated a high velocity in the nasal airway (around 12 m/s, red arrow) and a large negative pressure in the nasal airway (blue arrows). The velocities at downstream sites (NA, RA, and OA) were slow, although the negative pressures at such sites remain large (blue arrow). (C) In case 3, we simulated a high velocity in the OA (around 16.6 m/s, red arrow) and a large negative pressure in the OA (blue arrow). The case featured matched velocity and pressure grades at each area (blue arrow). NA = nasopharyngeal airway, OA = oropharyngeal airway, RA = retropalatal airway.

