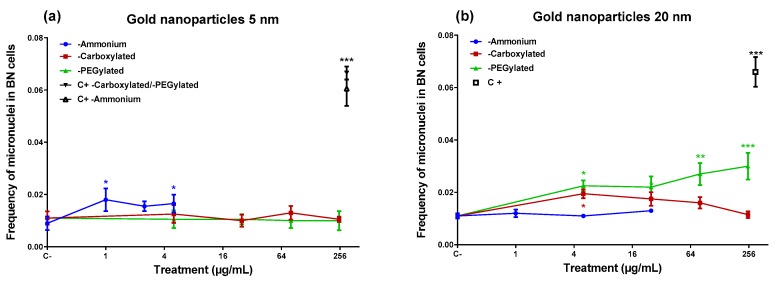
Figure 3.
Micronucleus frequency in binucleated (BN) BEAS-2B cells after a 48-h treatment with gold nanoparticles (core diameter: ~5 nm (a) or ~20 nm (b)). Treatment is expressed as the antilog of Log2 of the dose. Mitomycin C (150 ng/mL) was used as a positive control (C+; symbol on the right). The symbols represent means ± SD. Statistical significance in comparison with control cultures (Fisher’s exact test, two-tailed): * p < 0.05; ** p < 0.01; *** p < 0.001.

