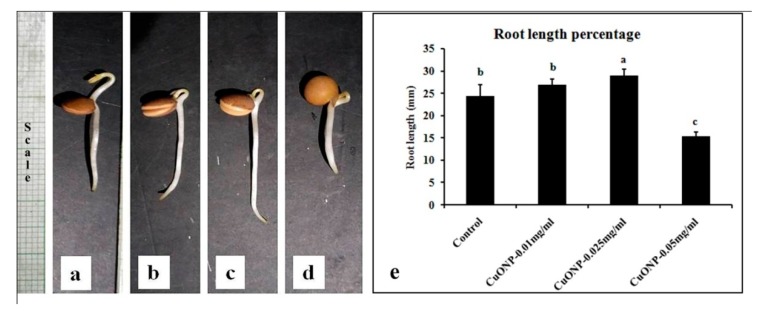
Figure 10.
Representative samples after 72 h germination in water: (a) Control; (b) CuONP-0.01; (c) CuONP-0.025, and (d) CuONP-0.05 mgmL−1. (e) Graphical representation of root length percentage of 50 seeds in triplicate. Different letters above the bar indicate significant difference (p < 0.05), using Duncan’s multiple range test. Same letter above the bar denotes no significant difference between the groups.

