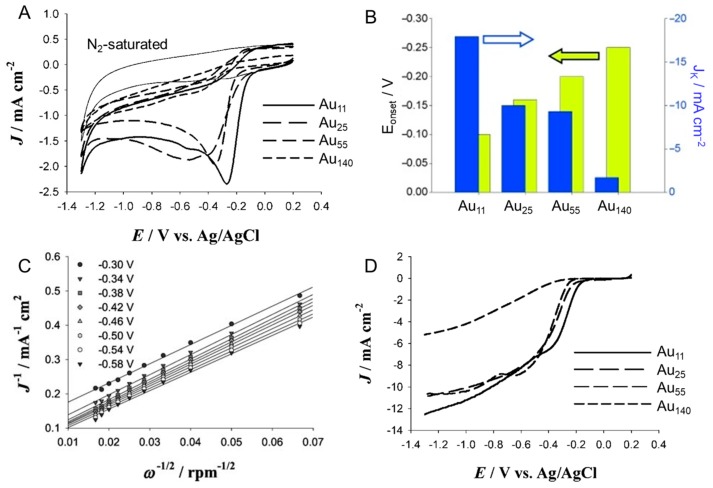
Figure 7.
(A) Cyclic voltammograms of Aun(SR)m/GCE (n = 11, 25, 55, and 140) saturated with O2 and Au11(PPh3)8Cl3/GCE saturated with N2 (thin solid curve). (B) Current density and overpotential of ORR activity with each size of Aun NCs. (C) Koutecky–Levich plots at different applied potentials of a GCE modified with Au11(PPh3)8Cl3. (D) Rotating-disk voltammograms (rotation rate: 3600 rpm) of various Aun(SR)m/GCE (n = 11, 25, 55, and 140). Panels (A–D) are reproduced with permission from reference [111]. Copyright Wiley-VCH, 2009.

