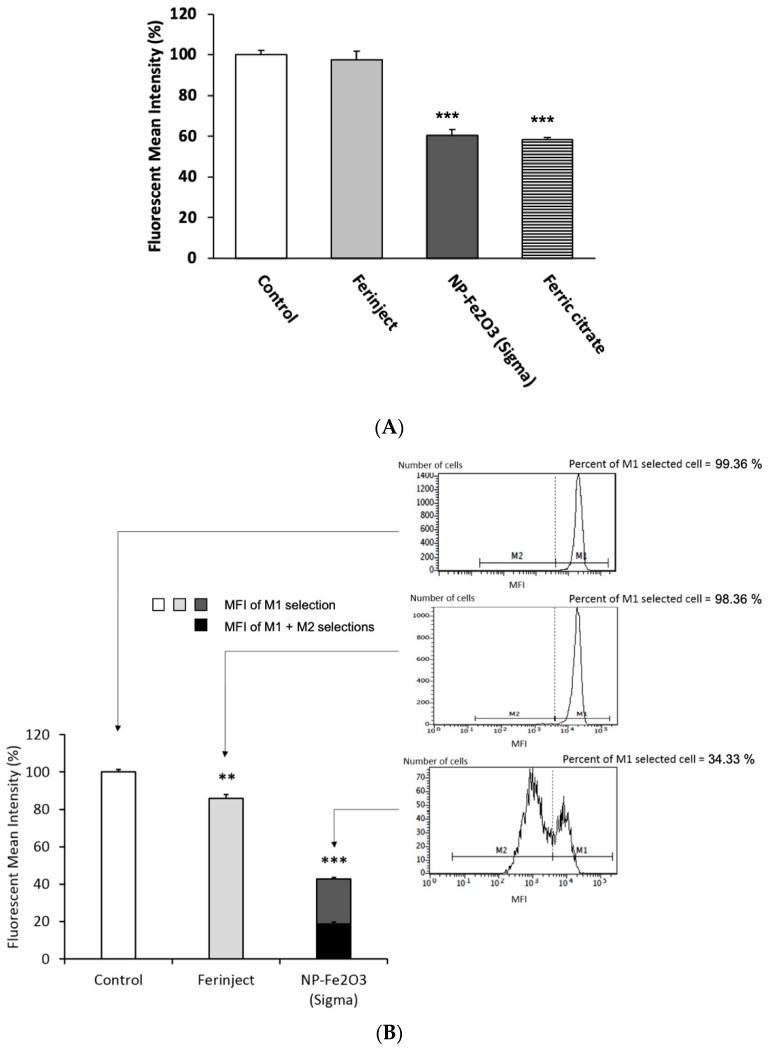
Figure 7.
Cell physiology studies of J774A.1 cells incubated 24 h at 37 °C, 5% CO2 with or without FERINJECT® or Fe2O3-NP. Pannel (A). Mitochondrial cell assay is measuring fluorescence of Rhodamine 123 accumulated in cells. Analyses with Facscalibur cytometer. Pannel (B). Analysis of the glutathione-based antioxidant system. Variations of the intracellular levels of reduced glutathione (GSH). GSH conjugate with monochlorobimane (MCB) form a fluorescent signal which is analysed by Cytometer. Statistical confidence (student’s t-test) is indicated as follows ** p ≤ 0.01; *** p ≤ 0.001.

