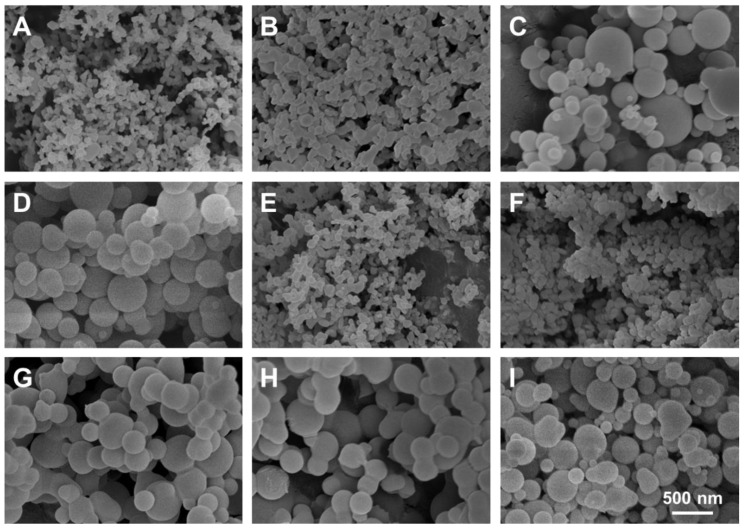
Figure 3.
SEM images of samples prepared under different operating conditions (as shown in Table 3). (A) 1:2, 1:2, 0.5 mL min−1; (B) 2:1, 1:2, 0.5 mL min−1; (C) 1:2, 1:8, 0.5 mL min−1; (D) 2:1, 1:8, 0.5 mL min−1; (E) 1:2, 1:2, 1 mL min−1; (F) 2:1, 1:2, 1 mL min−1; (G) 1:2, 1:8, 1 mL min−1; (H) 2:1, 1:8, 1 mL min−1; and (I) 1:1, 1:5, 0.75 mL min−1 (the operating parameters are EtOH/DCM (v/v), FIS/PVP (w/w), and the flow rate of the solution mixture (mL min−1), respectively).

