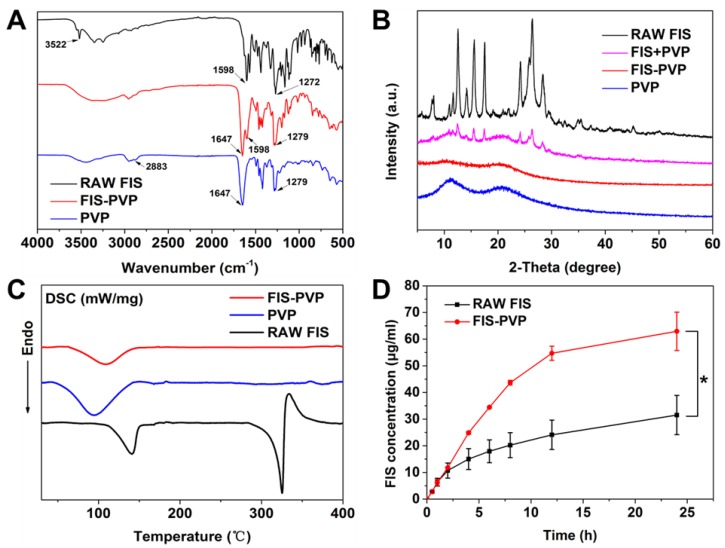
Figure 6.
(A) FTIR spectra of raw FIS, pure PVP, and FIS-PVP NPs. (B) XRD patterns of raw FIS, pure PVP, the physical mixture of FIS+PVP, and the SAS-processed FIS-PVP NPs. (C) DSC thermograms of raw FIS, pure PVP, and the SAS process-based FIS-PVP NPs. (D) Amount of soluble FIS in raw FIS as well as that released from the SAS process-assisted FIS-PVP NPs.

