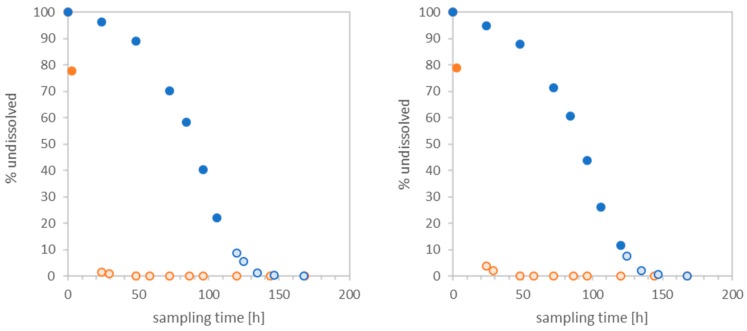
Figure 3.
Dissolution rate depending on surface area and flow-rate. CuO (left) and ZnO NM111 (right). Blue curve indicates ascending and orange curve descending flow-rate ramping. Unfilled circles indicate points with low reliability due to remaining mass <10%. Note the superimposed orange and blue dots.

