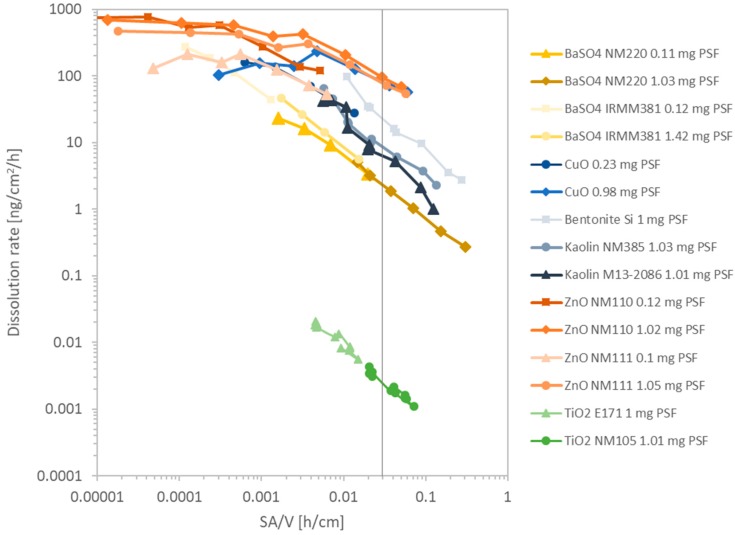
Figure 5.
Cumulated SA/V plot vs. dissolution rate k [ng/cm²/h] of 10 different tested nanomaterials in 15 different runs with varying initial masses. The dots of each run are connected through a line with each other for visualization purpose only. The family of TiO2 (nano)forms is displayed in green, BaSO4 (nano)forms in yellow, CuO in blue, ZnO in shades of orange, and aluminosilicates Bentonite and Kaolin in grey. The vertical line displays the optimum SA/V.

