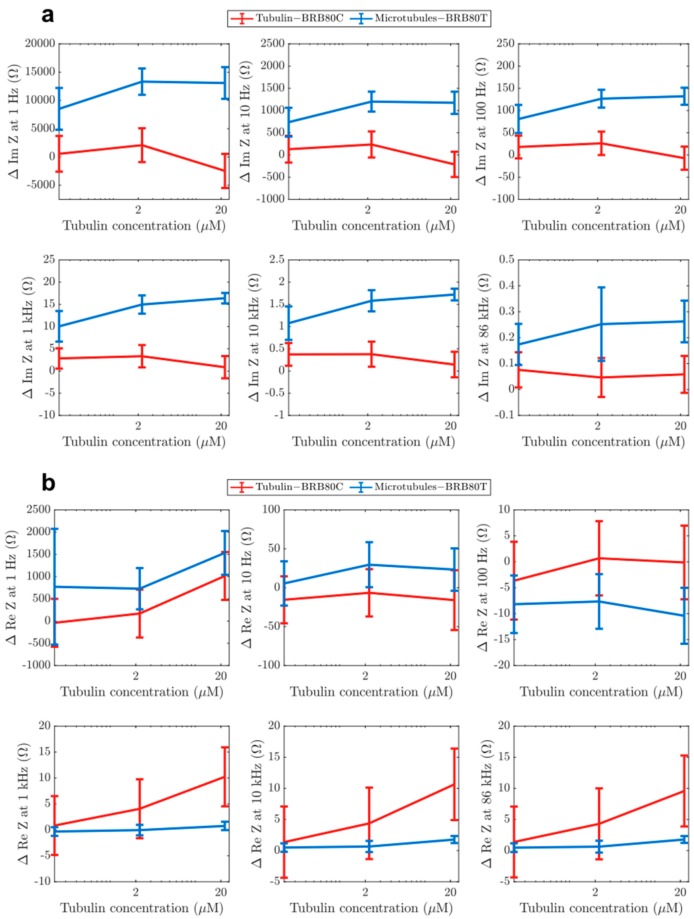
Figure 5.
Graphs showing differences in the (a) imaginary from Figure 3 and (b) real component of impedance from Figure 4 as a function of tubulin concentration at input AC frequencies of 1 Hz, 10 Hz, 100 Hz, 1 kHz, 10 kHz and 86 kHz. Graphs display average values. Error-bars represent standard deviation.

