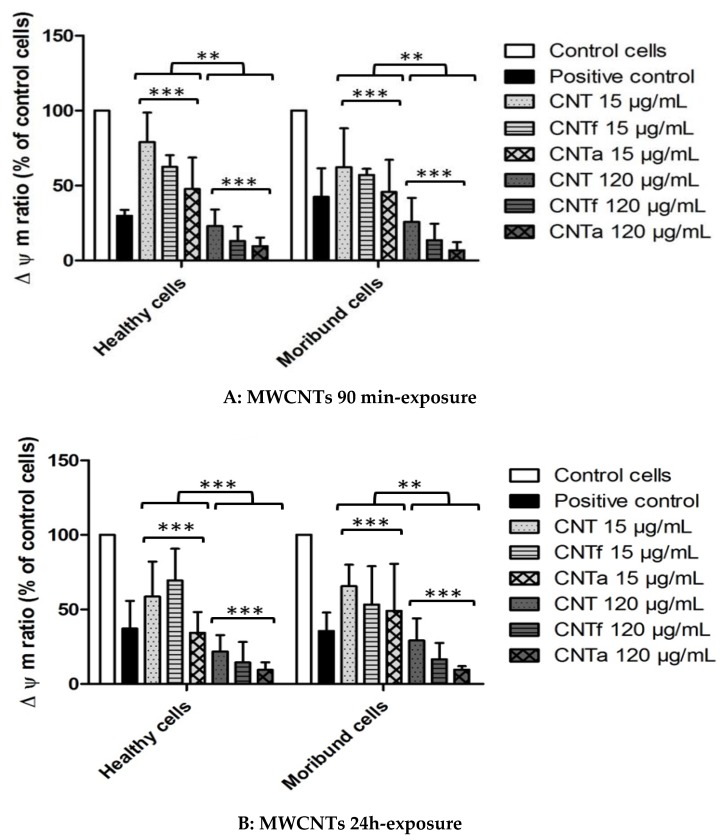
Figure 6.
Mitochondrial membrane potential (∆Ψm) analysis after 90 min (A) and 24 h (B) exposure to MWCNTs. Ratio of DiOC6 mean fluorescence of MWCNTs treated cells on untreated control cells after 90 min or 24 h exposure to 15 μg·mL−1 or 120 μg·mL−1 of CNT, CNTf and CNTa. Healthy cells (PI−, left side) and moribund cells (PI+, right side). ANOVA test, comparison with the negative control (untreated cells) and by dose effect have been shown. * p ≤ 0.05, ** p ≤ 0.01 and *** p ≤ 0.001). CCCP was used as positive control. PI: propidium iodide.

