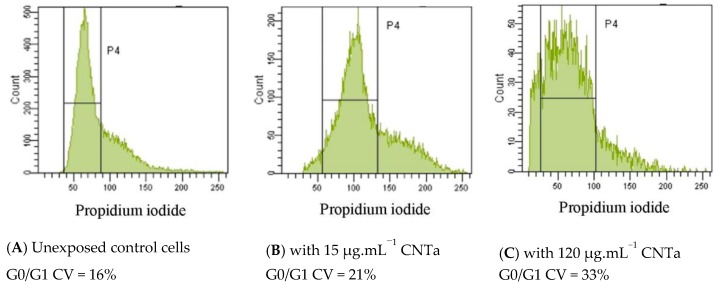
Figure 7.
Genotoxicity evaluation with PI chromatin decondensation analysis by flow cytometry (FCM). Example of obtained results after 24 h exposure to 15 μg·mL−1 and 120 μg·mL−1 of CNTa. (A) Histograms of control cell cycle as G0/G1, S/G2+M phases; (B) Weak enlargement of G0/G1 CV peak after exposure to 15 μg·mL−1 CNTa (P4 area window), (C) Stronger enlargement of G0/G1 CV peak after exposure to 120 μg·mL−1 CNTa.

