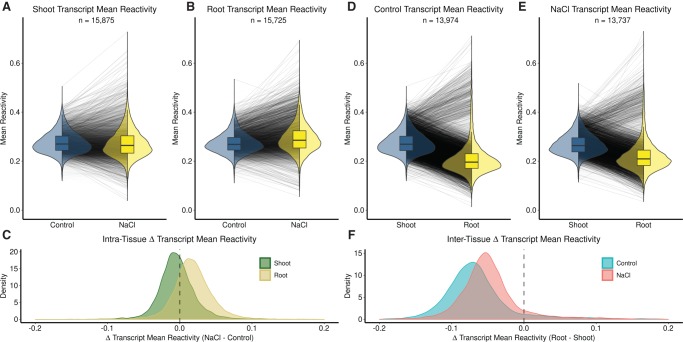
FIGURE 2.
Structuromes are tissue-specific and converge upon NaCl stress. We compared the distributions of mean reactivity of each transcript as box-violins. (A,B) Distributions of transcript mean DMS reactivity are plotted for intra-tissue (control vs. NaCl) comparisons, with control conditions colored in blue and NaCl-treated in yellow. Each line represents the change in mean reactivity between distributions of one transcript; strong changes (≥0.075) have a more intense shading to highlight differences. (C) The distribution of per transcript Δ mean reactivity after NaCl treatment is negative in shoot (decrease of DMS reactivity) and positive in root (increase of DMS reactivity). (D,E) Distributions of mean reactivity are plotted for inter-tissue (shoot vs. root) comparisons, with shoot conditions colored in blue and root in yellow. (F) The distribution of per transcript mean Δ reactivity between shoot and root is negative in both conditions, but less extreme under NaCl stress, illustrating structurome convergence under NaCl stress. A statistical summary of these results can be found in Table 1 and Supplemental Data S3: Table S1A. Additional plots detailing transcript regions (5′UTR, CDS, 3′UTR) are provided (Supplemental Figs. S2, S4)

