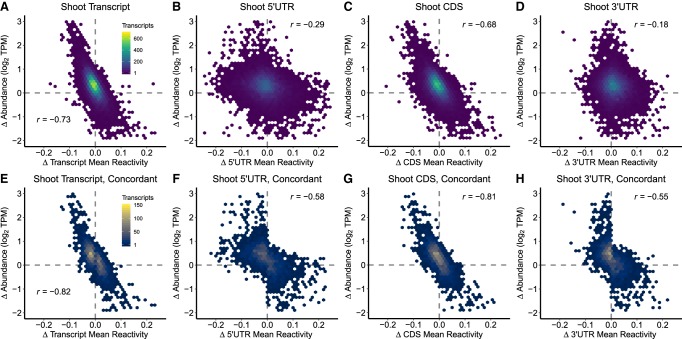
FIGURE 4.
Change in DMS reactivity inversely correlates with change in abundance. (A–D) For each transcript and transcript region in shoot, we assessed the relationship between change in mean DMS reactivity (Δ mean reactivity, NaCl-treatment mean reactivity − control mean reactivity, x-axis) and change in relative abundance [Δ abundance, log2(TPMNaCl) − log2(TPMcontrol), y-axis] between control and NaCl treatment. This revealed a strong inverse correlation (Table 2A; Supplemental Data 3: Table S6A). (E–H) Transcripts that share the same sign of Δ mean reactivity amongst their 5′UTR, CDS, and 3′UTR regions were subset as concordant. For each transcript and transcript region of these fully concordant transcripts, we assessed the relationship between the change in mean reactivity (Δ mean reactivity, NaCl mean reactivity − control mean reactivity, x-axis) and the change in relative abundance [Δ abundance, log2(TPMNaCl) − log2(TPMcontrol), y-axis] between control and NaCl-treatment in shoot, revealing a strong enhancement of the inverse correlation in all regions (Table 2C; Supplemental Data 3: Table S6A,D). The identical analyses for root data are provided (Supplemental Fig. S7).

