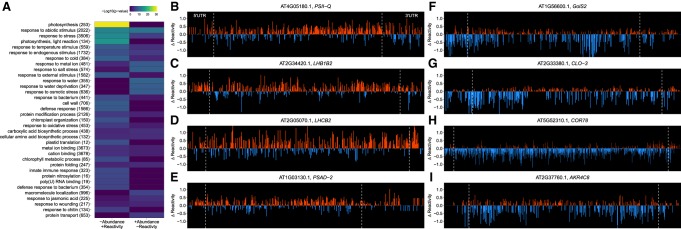
FIGURE 7.
Concordant transcripts reveal suppression of photosynthesis genes. (A) Concordant transcripts from shoot were separated into those that increased in abundance and decreased in mean reactivity (+abundance/−reactivity) and those that decreased in abundance and gained in mean reactivity (−abundance/+reactivity) after salt stress. These subsets were used in a series of GO analyses (Tian et al. 2017) and summarized as a heatmap. The full results for shoot and root are also provided (Supplemental Data S4: Tables G33–G36). The set of (+abundance/−reactivity) transcripts shows enrichment in categories pertinent to salt stress response. Conversely, the set of (−abundance/+reactivity) transcripts shows functional categories not specifically associated with salt stress, and particularly illustrates that photosynthesis genes concordantly gain in reactivity and lose abundance under salt stress. Concordant change of all three transcript regions therefore may particularly modulate stress-induced abundance changes. (B–E) Single nucleotide changes of select concordant photosynthesis related genes. (F–I) Single nucleotide changes of select concordant salt response transcripts. For both sets of single nucleotide plots, only A and C nucleotides are plotted; plots are extended to the last 3′ nucleotide where a change in reactivity could be resolved.

