FIGURE 8.
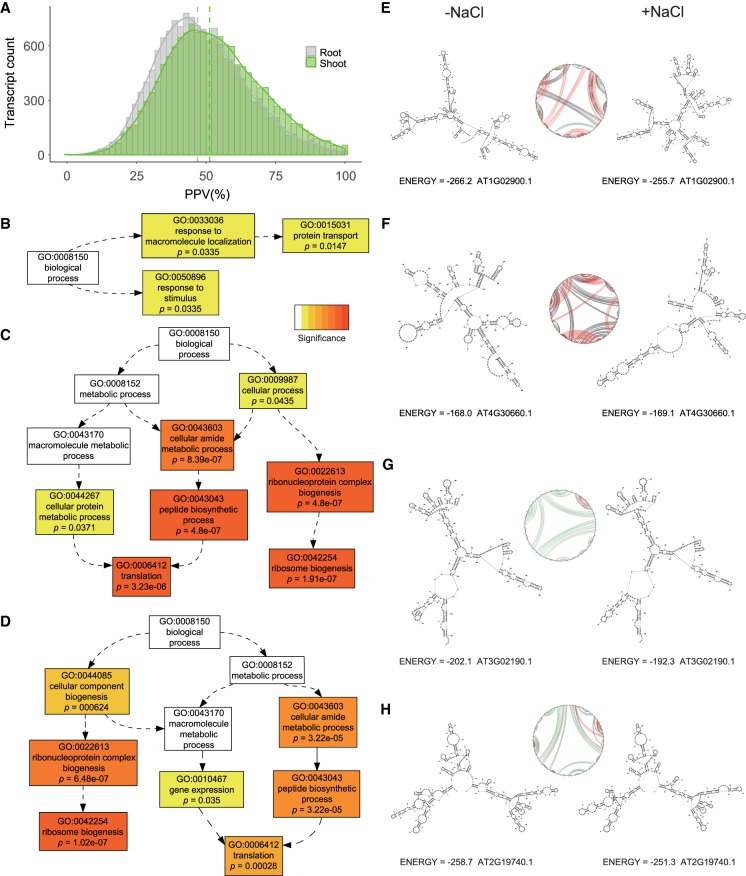
Folding analyses suggest core function of RNA structure in salt stress response. (A) PPV distribution of 15,708 mRNAs in shoot (green) and 15,557 mRNAs in root (gray). PPV is the fraction of base pairs that appear in two different structures of the same RNA; thus it is bounded by 0 and 1, with 1 indicating 100% identical base pairings. Thus, PPV values quantify the structural differences between control and salt stressed conditions. Dashed lines indicate the mean PPV in root (gray; mean: 46.96) and shoot (green; mean: 51.30). (B) Tails of the PPV distribution were submitted to agriGOv2 (Tian et al. 2017). GO categories “response to stimulus” and “protein transport” are overrepresented in the 5% of the transcripts with lowest PPV in root (but not in shoot). (C) Transcripts involved in translation and ribosome biogenesis are enriched in the 5% of transcripts with highest PPV in shoot. (D) Transcripts involved in translation and ribosome biogenesis are also overrepresented in the 5% of transcripts with highest PPV in root. (E) A low PPV transcript example (AT1G02900.1, RAPID ALKALINIZATION FACTOR 1 [RALF1], PPV = 22.7) showing structural changes between control condition (left) and salt stress (right). (F) Another low PPV transcript example (AT4G30660.1, low temperature and salt responsive protein family gene, PPV = 0) with dramatic structural change between control (left) and salt stress (right). (G) A high PPV transcript example (AT3G02190.1, 60S ribosomal protein L39 [RPL39B], PPV = 87.79) with similar structure between control and salt stress. (H) Another high PPV transcript example (AT2G19740.1, 60S ribosomal protein L31 [RPL31A], PPV = 97.38) with similar structure between conditions. For E–H, all structures were generated from root data. Circle plots provide an abstraction of the base-pairing (Reuter and Mathews 2010). Nucleotides are arranged in sequence order around the circle. Black lines link bases paired only in control; red lines link bases paired only in salt stress, green lines link bases paired in both conditions. GO analysis results (Supplemental Data S4: Tables G37–G40) and all PPV statistics (Supplemental Data S5) are provided.

