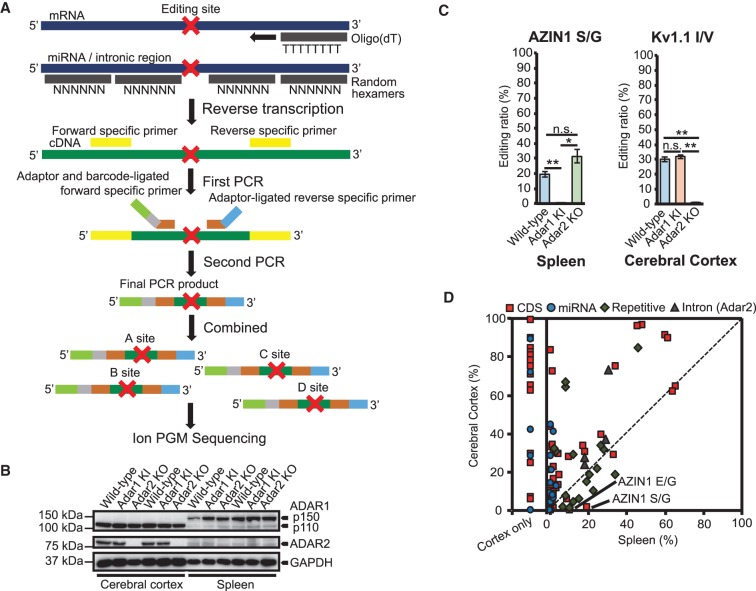
FIGURE 1.
Comparison of RNA editing ratios between the cerebral cortex and spleen of WT mice. (A) The protocol to create ion amplicon libraries for the evaluation of RNA editing ratios at multiple sites. After reverse-transcription using oligo(dT) primers or random hexamers, the first PCR was performed using cDNA (in green) that included an RNA editing site (shown as a red cross) and the first primers specific for each editing site (in yellow). Then, a second round of PCR was performed using an aliquot of the first PCR product as a template, with each second forward primer specific to the editing site and containing an A Adaptor (in light green), an Ion Xpress Barcode (in gray), editing site-specific sequences (in brown), and a reverse primer that contained a trP1 adaptor (in light blue); editing site-specific sequences (in brown) were also included. All second PCR products were designed to be 190 to 200 bp in length. After 50–300 PCR products were combined, the samples were sequenced using an Ion Torrent Personal Genome Machine (Ion PGM) system. (B) Immunoblot analysis of adenosine deaminase acting on RNA (ADAR)1 p110, ADAR1 p150, and ADAR2 expression in cerebral cortexes and spleens isolated from wild-type (WT), Adar1E861A/E861AIfih−/− mice (Adar1 KI) and Adar2−/− Gria2R/R (Adar2 KO) mice (n = 2 mice for each group). The expression of GAPDH is shown as a reference. (C) Validation of the methodology by referring to the editing ratios of known ADAR1 (AZIN1 serine/glycine [S/G]) and ADAR2 sites (Kv1.1 isoleucine/valine [I/V]). Editing ratios at each site in each indicated tissue isolated from WT, Adar1 knock-in (KI), and Adar2 knockout (KO) mice are displayed as the mean ± SEM (n = 3 mice for each group; Student's t-test, [*] P < 0.05, [**] P < 0.01, n.s., not significant). (D) Editing ratios of all sites examined were compared between cerebral cortexes and spleens isolated from WT mice. Values are displayed as the mean of values from three mice. The red squares, blue circles, green diamonds, and gray triangles represent editing sites in coding sequences (CDS), microRNAs (miRNAs), repetitive elements (REs), and introns, respectively. Editing ratios for sites that could only be amplified from the cerebral cortex are separately displayed in the “Cortex only” fraction. See Supplemental Charts to access an interactive version of this chart in which each editing site can be identified.

