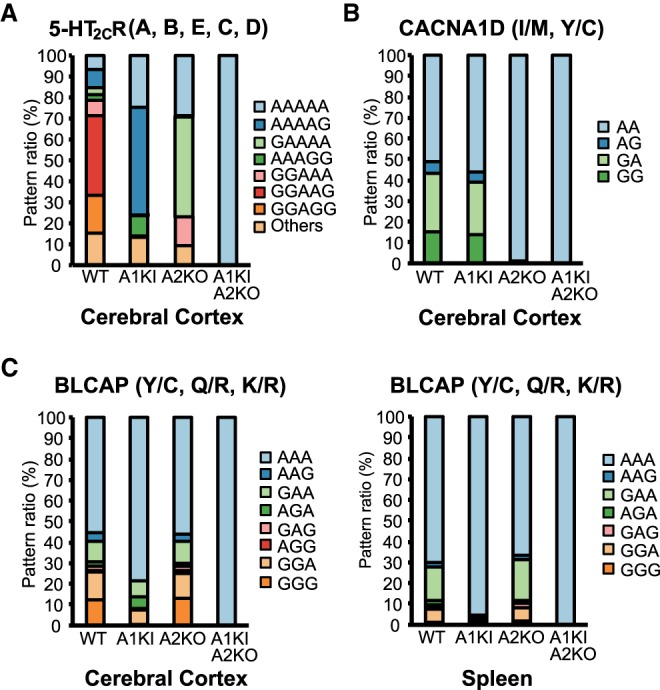
FIGURE 7.

Comparison of the combined editing pattern in the same transcripts among Adar mutant mice. (A–C) The frequency of each combined editing pattern of the five sites (A, B, E, C, and D in order) in the serotonin 5-HT2CR (A), the two sites (isoleucine/methionine [I/M] and tyrosine/cysteine [Y/C] in order) in CACNA1D (B), and the three sites (Y/C, glutamine/arginine [Q/R] and lysine/arginine [K/R] in order) in BLCAP (C), in the indicated tissues isolated from wild-type (WT; n = 3 mice), Adar1E861A/E861AIfih−/− mice (Adar1 knock-in [KI]; n = 3 mice), Adar2−/−Gria2R/R (Adar2 knockout [KO]; n = 3 mice), and Adar1 KI Adar2 KO (n = 2 mice) mice is displayed as a percentage.
