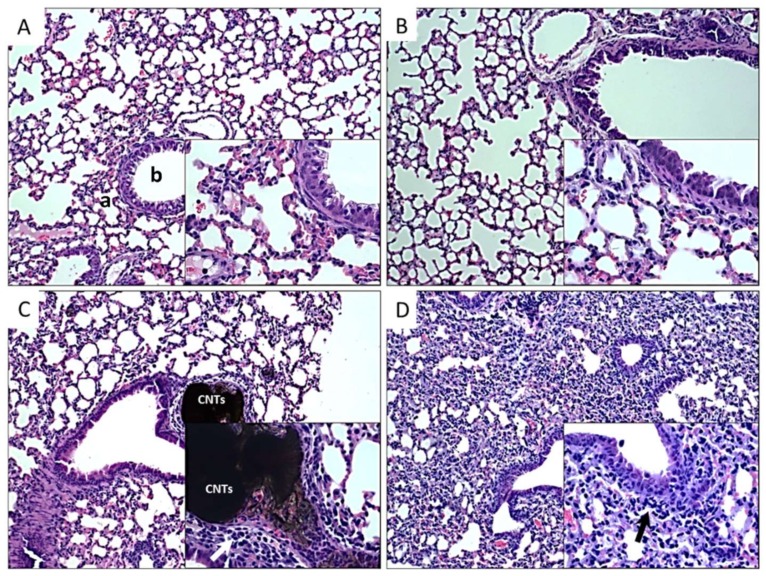
Figure 5.
Histopathological findings in lungs of mice exposed to different types of CNTs. Microphotographs show lung sections of mice exposed to: A, control group non exposed, the normal morphology of bronchiole (b) and alveoli (a) is shown; B, P-CNTs exposed group. C, UP-CNTs exposed group, accumulation of CNTs in the artery, and inflammatory infiltrate in alveolar walls (arrow). D, FITC-CNTs exposed group, inflammatory infiltrate (arrow), of note is the decrease of the alveolar sacs in the lung. Microphotographs are representative of one experiment. Magnification 10X. Insets show magnification at 40×. H&E staining.

