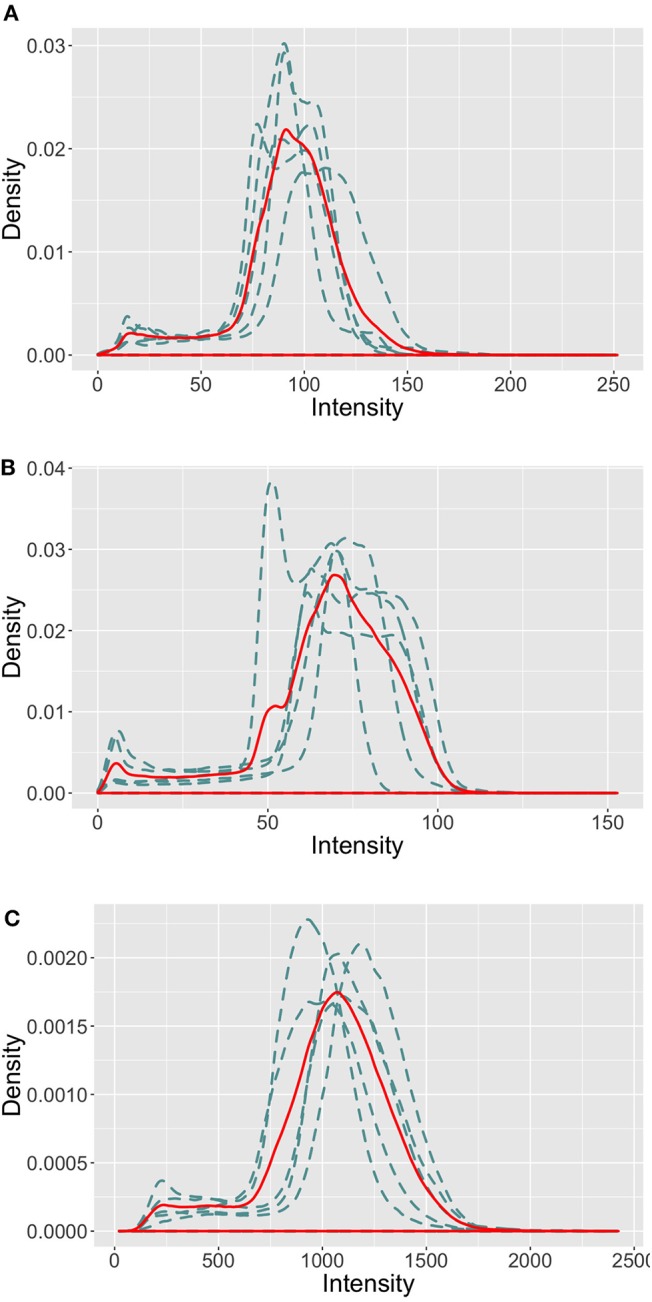
Figure 2.

Intensity profiles in the brain area of the FLAIR images in the MICCAI 2016 train set. The blue dashed line represents the intensity distribution of each image, the red solid line represents the mean intensity distribution of the site images. (A) Site 01. (B) Site 07. (C) Site 08.
