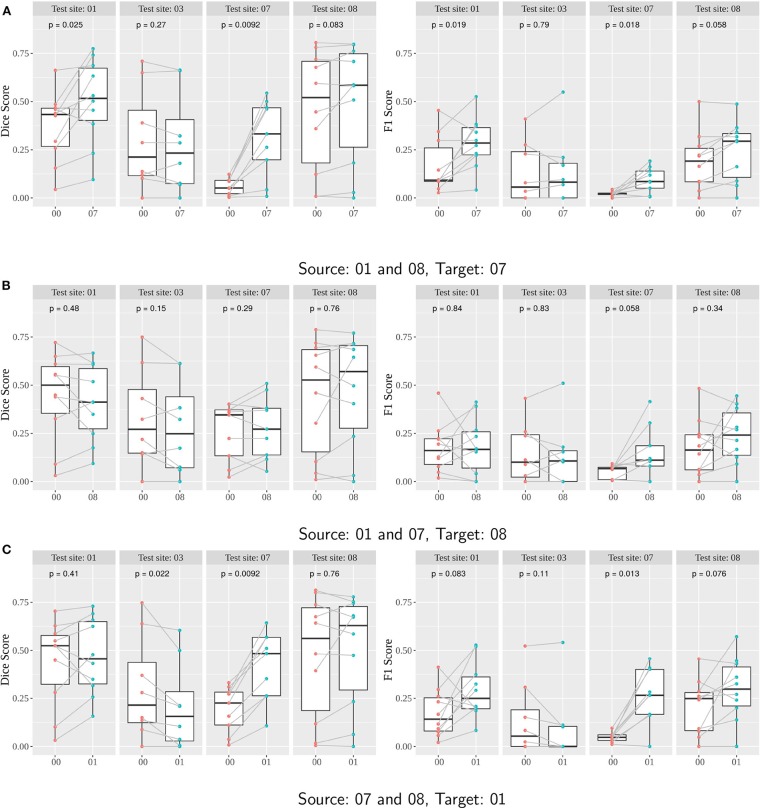
Figure 7.
(A–C) Performance of Seg-JDOT with multi-site source and single-site target domain adaptation. Each row corresponds to a combination of source and target. Dice score (left column) and F1 score (right column) are computed with no adaptation (00) and with Seg-JDOT, where the direction of the domain adaptation is indicated (07, 08, or 01). For each combination of source and target, performances are given for all the four testing sites. Each point is a patient of a given site; performances of a patient with and without Seg-JDOT are tracked. For each site, the p-value of the paired Wilcoxon test is reported.

