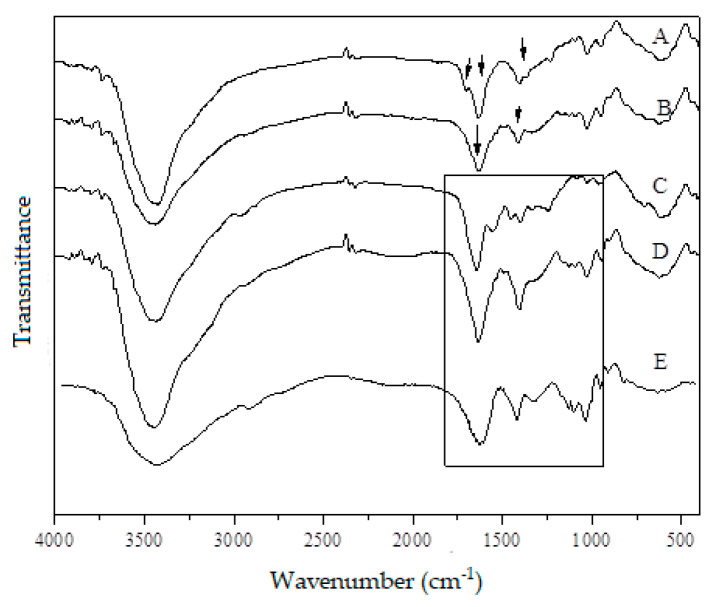
Figure 2.
Fourier Transform Infra-red (FT–IR) spectra of (A) sodium alginate, (B) gelatin, and of hydrogels with silver nanoparticles at different concentrations (C) 1 mM, (D) 2 mM, and (E) 4 mM. Arrows of spectrum A correspond to the bands around 1650 cm−1 (C=C stretching), 1250 cm−1 (C–O–C stretching); arrows of spectrum B correspond to 1640 cm−1 and 1510 cm−1 of amide carbonyl (C=O and C=N stretching vibration); spectra of the hydrogel (square of C, D, and E) are the bands around 1600–1500 cm−1.

