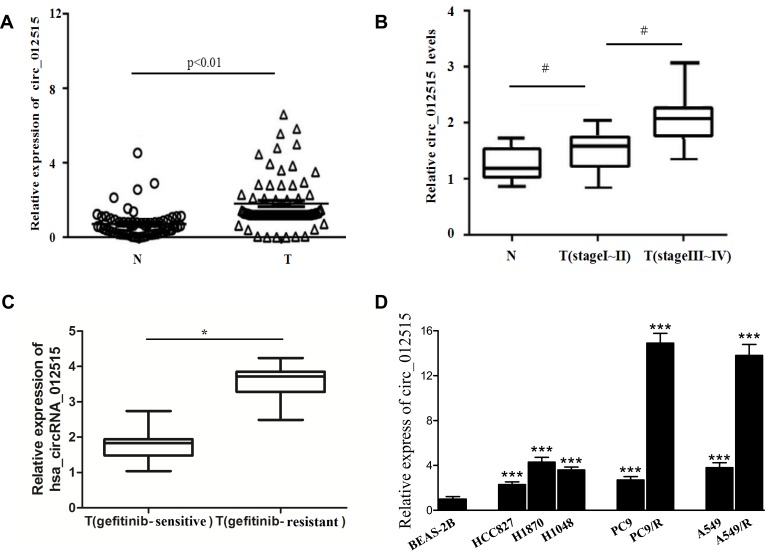
Figure 3.
RT-PCR verification of hsa_circRNA_012515 expressions in clinical tissue samples and cell lines. (A) Shows the expressions of hsa_circRNA_012515 in cancerous tissues and paracancerous tissues from NSCLC patients (N indicates paracancerous tissues; T indicates cancerous tissues, n=83); (B) Shows the expression of hsa_circRNA_012515 in patients of different tumor stages (N indicates paracancerous tissues, n=83; T(stage I–II), n=43; T(stage III–IV), n=40); (C) Shows the expressions of hsa_circRNA_012515 in Peripheral blood samples from gefitinib-resistant (n=35) and gefitinib-sensitive (n=25) NSCLC patients. (D) Shows the expressions of hsa_circRNA_012515 in the pulmonary epithelial cells, NSCLC cells and gefitinib-resistant NSCLC cell lines. All experiments were performed in triplicate. Data were expressed as mean±standard deviation. #Indicates significant difference as compared with the N group, *Indicates significant difference as compared with the T(gefitinib-sensitive) group, ***Indicates significant difference as compared with the BEAS-2B cell (P<0.05).

