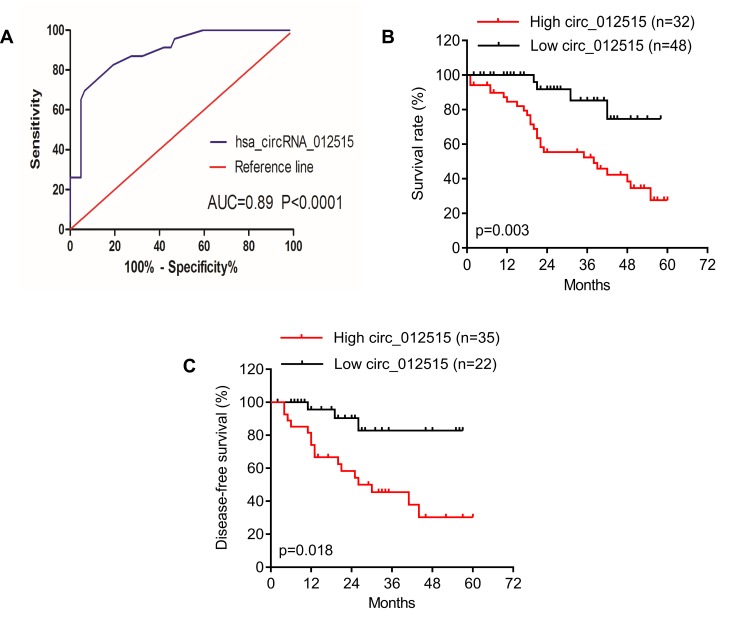
Figure 4.
Analysis on the diagnostic and prognostic values of hsa_circRNA_012515. (A) shows the analysis of ROC curve of hsa_circRNA_012515 expressions in NSCLC. (B and C) Show the relationships of the high and low expressions of hsa_circRNA_012515 with patients’ prognosis (PFS and OS) as analyzed based on the survival curve.

