
Figure 2. Distribution of the predicted and actual adherence value for RF model.
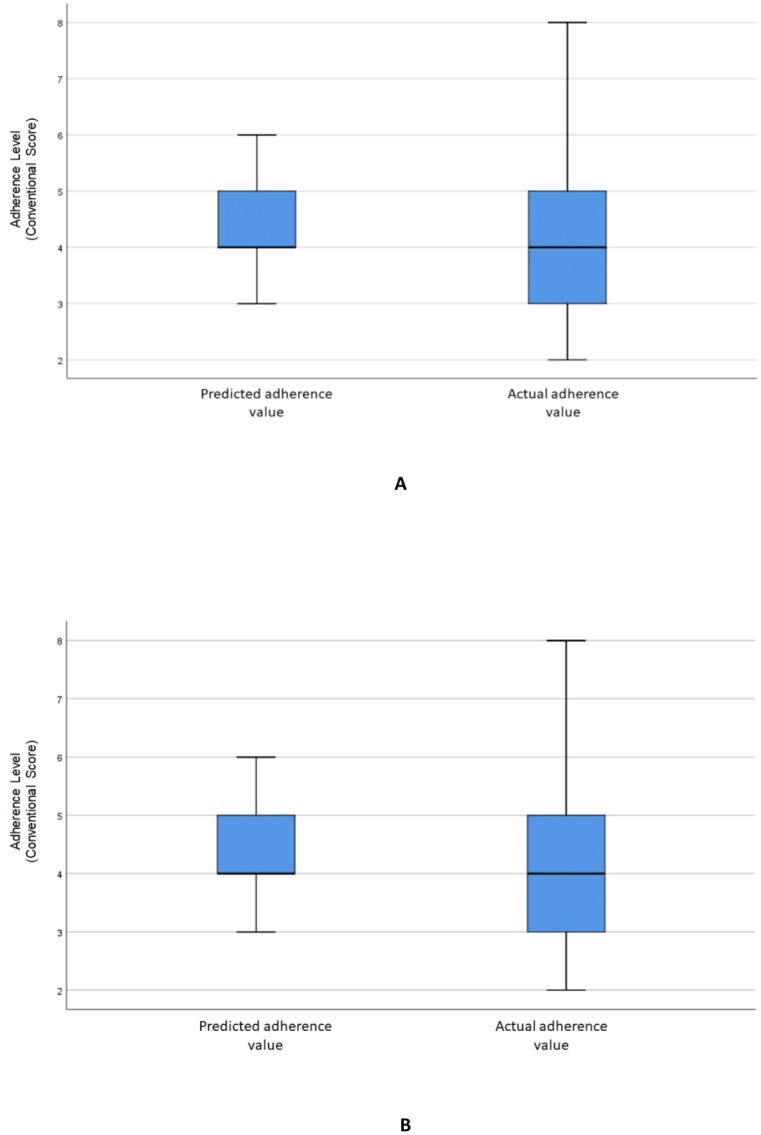
Boxplot of the adherence value distribution for the RF model with (A) all the variables and (B) the selected variables.
Official websites use .gov
A
.gov website belongs to an official
government organization in the United States.
Secure .gov websites use HTTPS
A lock (
) or https:// means you've safely
connected to the .gov website. Share sensitive
information only on official, secure websites.
Boxplot of the adherence value distribution for the RF model with (A) all the variables and (B) the selected variables.