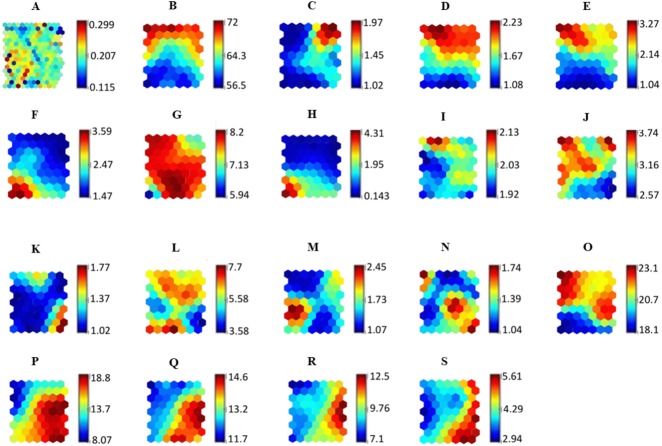
Figure 5. SOM representing the relationship of all variables against the adherence level.
The relationship between SOM component plane forms clusters that are represented in the (A) U-matrix. Each component plane in the SOM represents variables used in the study which are (B) Age, (C) Gender, (D) Ethnicity, (E) Religion, (F) Educational level, (G) Occupational field, (H) Monthly income, (I) Marital status, (J) Duration of antihypertensive medications intake, (K) Presence of other concomitant diseases, (L) Total number of antihypertensive medications taken per day, (M) Aids in antihypertensive medications intake, (N) Counseling for antihypertensive medications, (O) Specific necessity, (P) Specific concern, (Q) General overuse, (R) General harm and (S) Adherence level.

