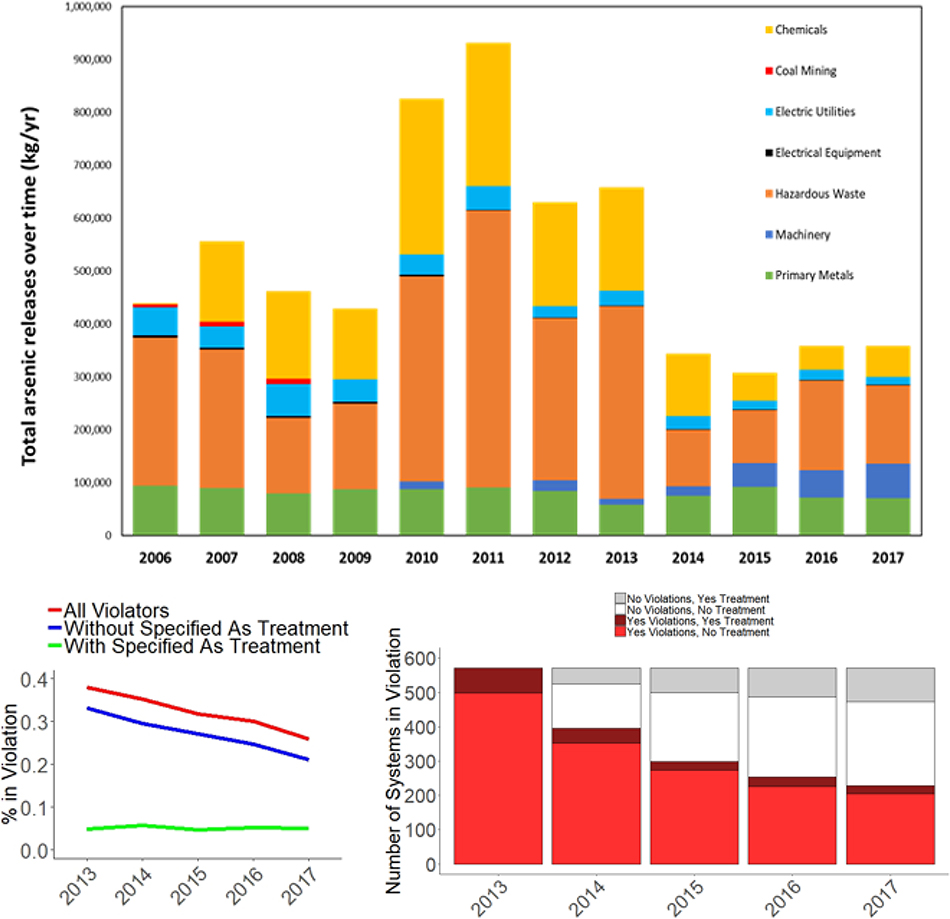
Figure 4.
(a) (top) Total arsenic releases to the CONUS as tracked by the Environmental Protection Agency’s Toxic Release Inventory from 2006 to 2017. The y-axis indicates arsenic released in kilograms/year; (b) (bottom left) The percentage of PWS in FAR violation from 2013 to 2017 with groups stratified by treatment report or no arsenic (As) treatment report. PWS with treatment NAs for certain years were included in the model. “Specified” treatments are those which are reportable in SDWIS and considered effective for arsenic removal (Table S2); (c) (bottom right) Baseline group of PWS in FAR violation starting in index year 2013 and progressing to 2017. PWS in violation without treatment are indicated in light red; PWS in violation with treatment in dark red; PWS no longer in violation without reported treatment in white; and PWS no longer in violation with treatment in gray.

