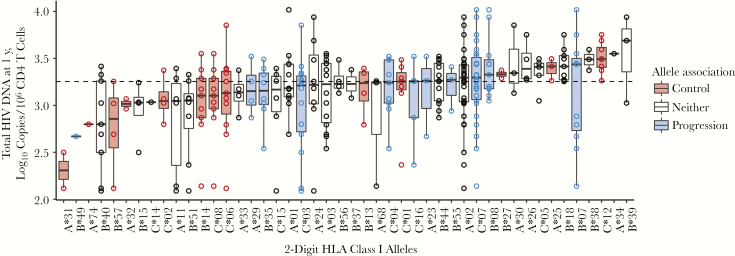
Figure 5.
Relationship between HLA class I alleles and total human immunodeficiency virus (HIV) DNA 1 year after antiretroviral therapy (ART) initiation. Alleles, shown on the x-axis, are ordered based on the median value of total HIV DNA for all individuals possessing that allele. Box plots show the distribution of total HIV DNA among individuals possessing the allele, and each observation is shown as an open circle. Data are shown for 58 individuals and a total of 316 alleles. For 1 individual, only B alleles were available and are included here; for another, only A and C alleles were available. Where individuals were homozygous for a given allele, it is shown only once. Dashed line represents median value of total HIV DNA for the entire cohort. Alleles were classified as being associated with disease progression (blue), disease control (red), or neither (white), based on those identified in the International HIV Controllers Study at a significance level of .05 [28].

