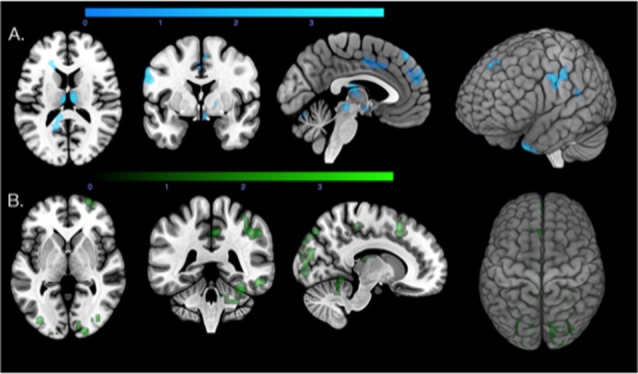
Figure 2.

Regions that show correlations between local β-amyloid, local tau, and increased functional connectivity. (A) Axial, coronal, and sagittal slices and a 3D render of the T-map (p < 0.05, extent threshold = 100 voxels) illustrating the regions with correlations between local β-amyloid and increased connectivity (blue). (B) Axial, coronal, and sagittal slices and a 3D render of the T-map (p < 0.05, extent threshold = 100) illustrating the regions with correlations between local tau load (green) and increased functional connectivity.
