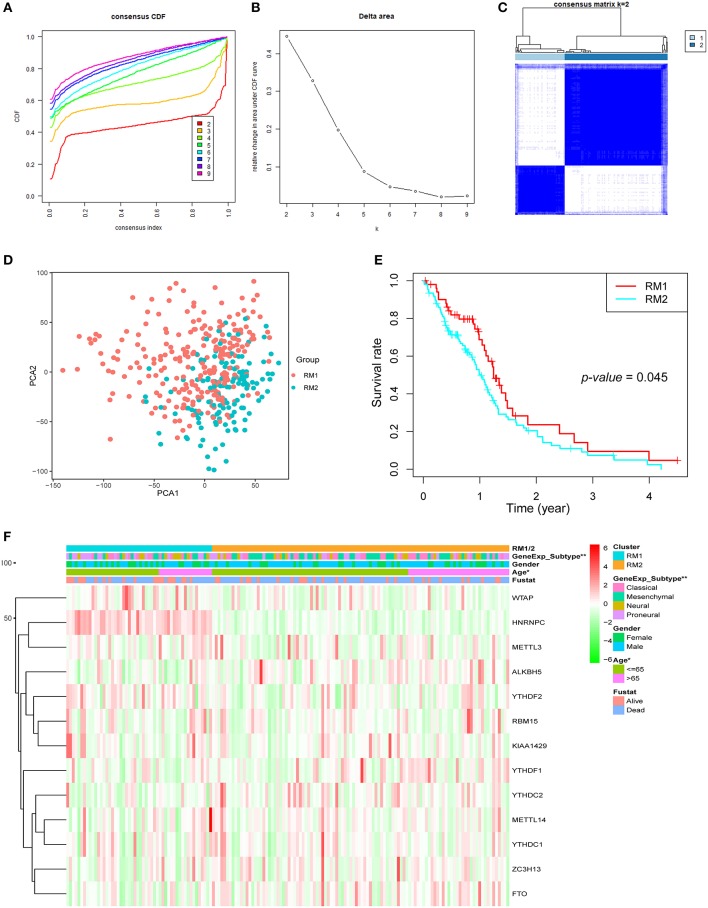
Figure 2.
Differential clinicopathological features and overall survival (OS) of GBM in the RM1/2 subgroups. (A) Consensus clustering cumulative distribution function (CDF) for k = 2–10. (B) Relative change in area under CDF curve for k = 2–10. (C) Consensus clustering matrix for k = 2. (D) Principal component analysis of the total mRNA expression profile in the TCGA dataset. GBM patients in the RM1 subgroup are marked with red, GBM patients in RM2 are marked with green. (E) Kaplan–Meier OS curves for different subgroups. (F) Heatmap and clinicopathologic features of the two clusters (RM1/2) defined by the m6A RNA methylation regulators consensus expression.

