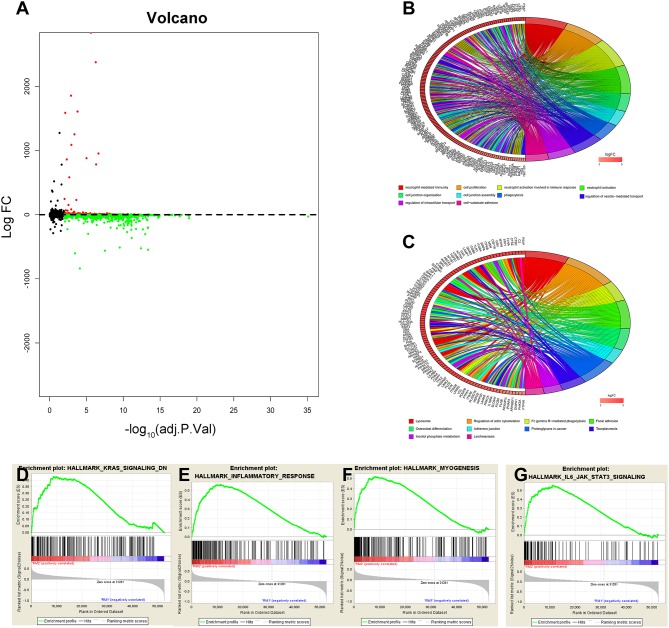
Figure 3.
Interaction among m6A RNA methylation regulators and functional annotation of GBM in RM1/2 subgroups. (A) Volcano plot of identified DEGs. The red dots represent upregulated DEGs, and the green dots represent downregulated DEGs. (B,C) Functional annotation of the upregulated DEGs in the RM2 subgroup of GO analysis (B) and KEGG pathway analysis (C). (D–G) GSEA revealed that genes with higher expression in the RM2 subgroup were enriched for hallmarks of malignant tumors.

