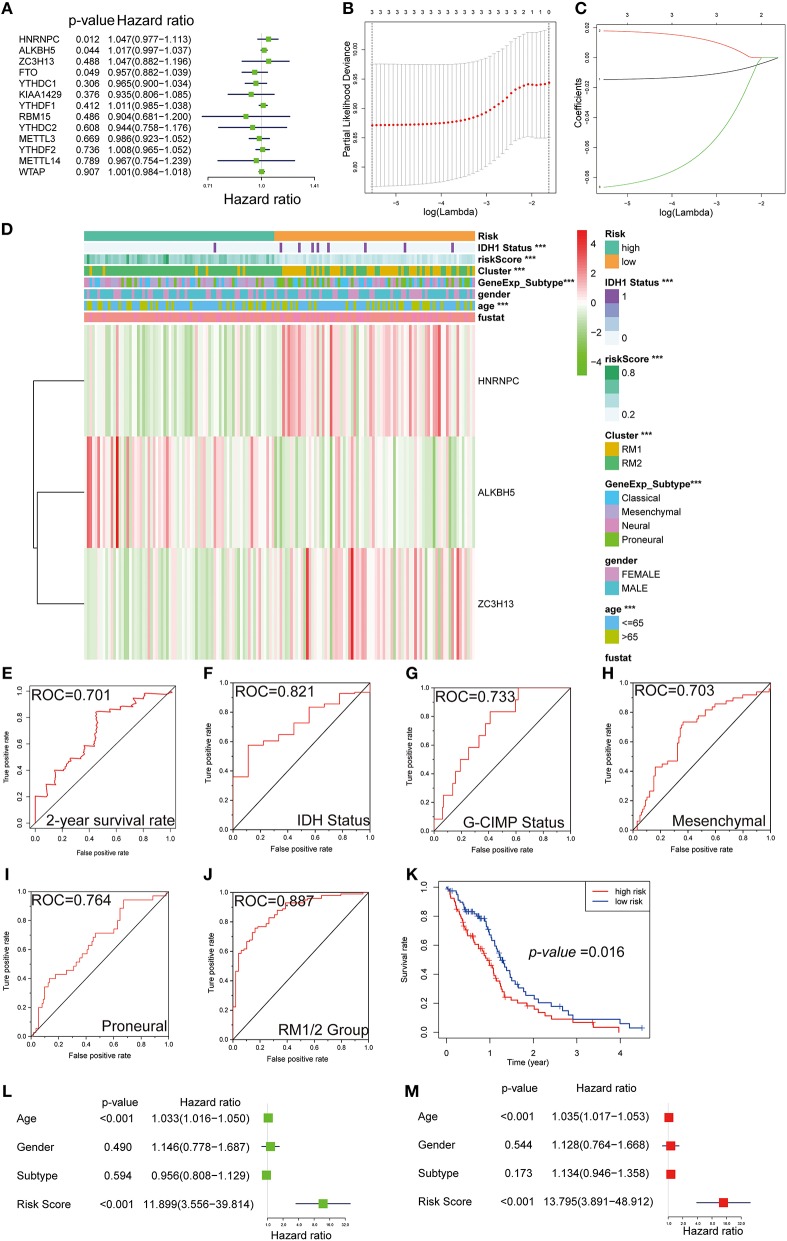
Figure 7.
Gene signature with m6A RNA methylation regulators. (A–C) The process of building the signature containing three m6A RNA methylation regulators. The hazard ratios (HR) (A), 95% confidence intervals (CI) calculated by univariate Cox regression, and the regression coefficients (C) calculated by multivariate Cox regression using LASSO (B) are exhibited. (D) The heatmap shows the expression levels of the three m6A RNA methylation regulators in low- and high-risk subgroups. The distribution of clinicopathological features was compared between the low- and high-risk groups. ***P < 0.001. (E–J) ROC curves show the predictive efficiency of the risk signature on the 2-year survival rate (E), IDH status (F), G-CIMP status (G), mesenchymal subtype (H), proneural subtype (I), and RM1/2 subgroups (J). (K) Kaplan–Meier survival curves for patients in the TCGA dataset assigned to high- and low-risk groups based on the risk score. (L,M) Univariate (L) and multivariate Cox regression analyses (M) of the association between clinicopathological factors (including the risk score) and OS of patients in the TCGA.

