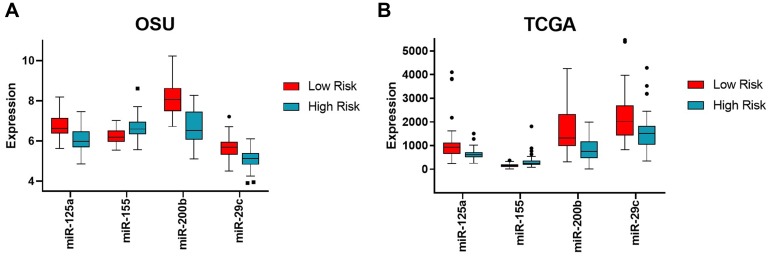
Figure 1. Expression levels of the four miRNAs in high versus low risk groups in the OSU and TCGA cohorts.
Expression levels of each miRNA (mir-125a, miR-155, miR-200b, and miR-29c) are shown as boxplots with the median and 95% confidence intervals for each of the binary risk groups (high versus low risk) for both OSU (A) and TCGA (B) cohorts. Low risk shown in red, high risk shown in cyan. Note the common trend with miR-155 being up-regulated in high risk score while the other three miRNAs being down-regulated in high-risk score between cohorts.

