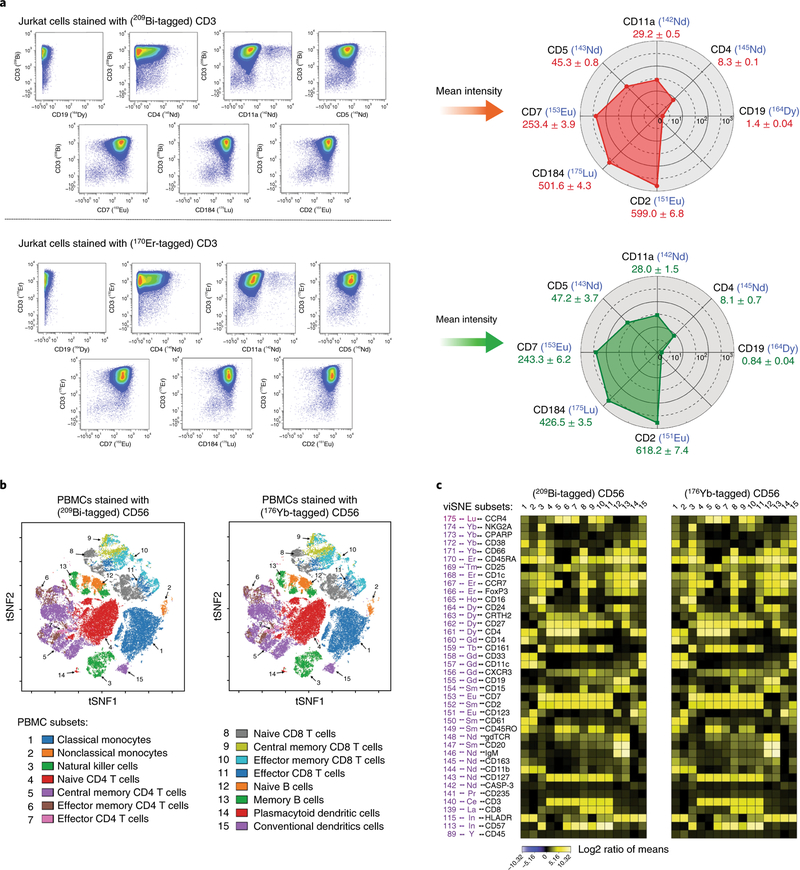
Fig. 9 |. Comparisons of bismuth- and lanthanide-tagged antibodies in single-cell assays.
a, Left, Comparable biaxial scatter plots of CD3 versus CD19, CD4, CD11a, CD5, CD7, CD184, and CD2 in Jurkat cells stained with either 209Bi- or 170Er-tagged CD3. a, Right, Data analysis from plots at left, depicted in radar charts of the mean intensities of the seven markers. b, Comparable immunophenotypic gating as shown by viSNE plots of data from human PMBCs stained for 40 markers and either 209Bi- or 176Yb-tagged CD56. Fifteen cell subsets were identified (gating hierarchy described in Supplementary Fig. 2). c, Data from b depicted with heat maps. There is a strong correlation between data collected using 209Bi- and 176Yb-tagged CD56 (Pearson correlation, r = 0.991, P < 0.00001, Supplementary Fig. 1b).

