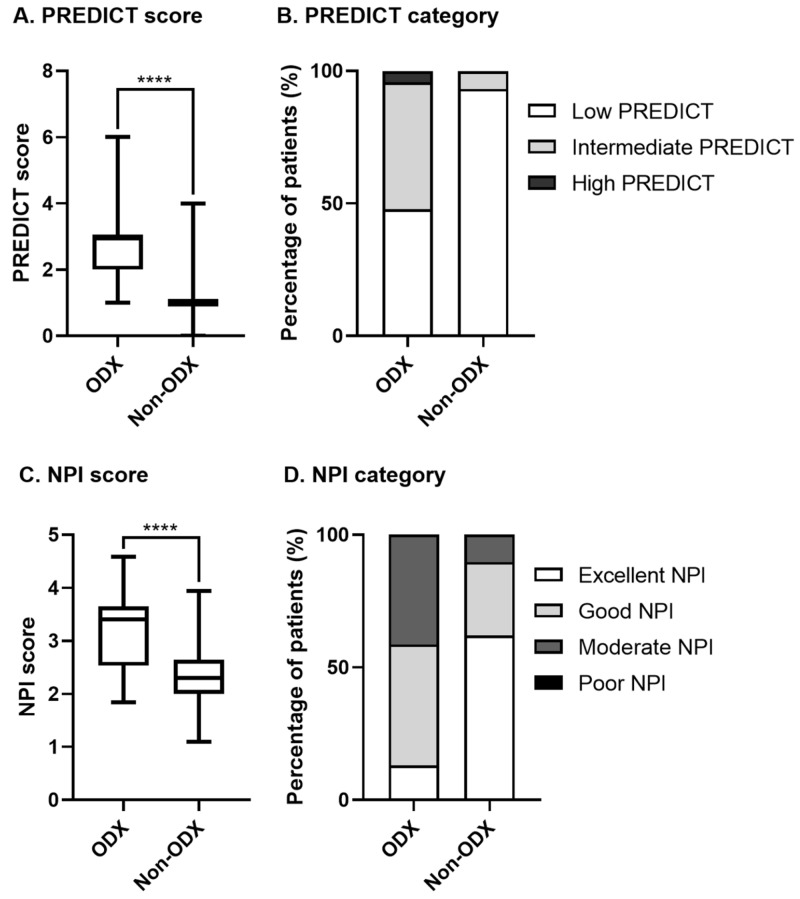
Figure 2. PREDICT and Nottingham prognostic index (NPI) scores for patients selected for Oncotype DX (ODX) testing compared to patients not genetically profiled.
A) Median PREDICT score for patients in the ODX and non-ODX groups (Mann-Whitney, P<0.0001); B) proportion of low, intermediate, or high PREDICT scores for patients in the ODX and non-ODX groups (chi-squared, P<0.0001); C) median NPI score for patients in the ODX and non-ODX groups (Mann-Whitney, P<0.0001 ); and D) proportion of excellent, good, moderate, or poor NPI scores for patients in the ODX and non-ODX groups (chi-squared, P<0.0001); ODX group, patients with cancers that were genetically profiled through Oncotype DX testing; non-ODX group, patients that did not have Oncotype DX testing; for patients with multifocal disease, the highest PREDICT or NPI score was used.

