
Fig. 5: Phase diagram of chromatophore activity showcases design principles for efficient organelle-scale single-electron transport.
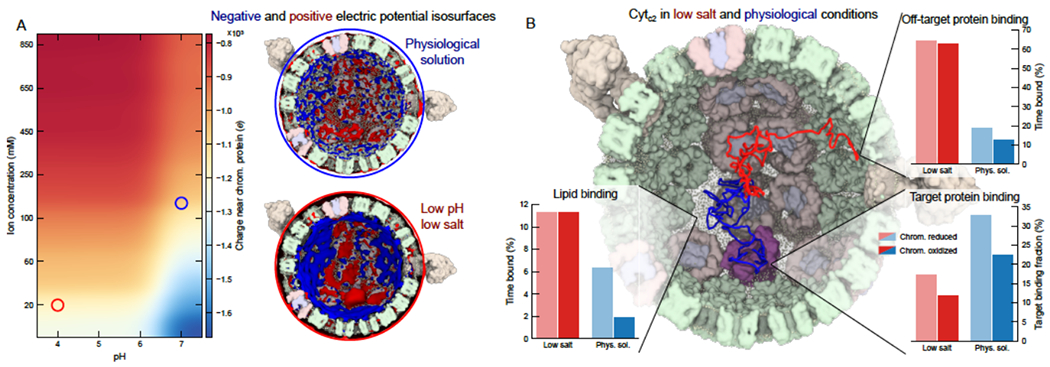
(A) Dependence of chromatophore electrostatics on pH and ion concentration. The heatmap at left shows the average charge of the chromatophore, including solvent and fixed contributions, within 1 nm of the membrane surface. The charge was calculated using APBS. The images of the chromatophore at right depict 0.1 (blue) and −0.1 (red) kT electrostatic isosurfaces for low salinity (pH 4, 0.02 M; bottom, red circle) and physiological conditions (pH 7, 0.15 mM; top, red circle). (B) Effect of solution conditions on cyt. c2 targeting efficiency from BD simulations. The central image depicts two independent representative traces of cyt. c2 moving through reduced chromatophores in low salinity (red trace) and physiological conditions (blue trace). Electrostatic potentials representing the chromatophores were obtained from APBS. For each condition, 500 simulations of a single cyt. c2 were performed, each simulation lasting 10 μs. The cyt. c2 molecules were all initially in the center of the chromatophore. The trajectories provided the time the cyt. c2 spent within 1 nm of off-target proteins, lipids and target proteins, as depicted in the bar charts at left. Although surface binding is enhanced overall, the targeting efficiency, or the ratio of the likelihood of being in contact with a target-protein compared to an off-target protein, is considerably lowered under low salinity conditions, as shown in the bar chart on the right.