
Fig. 6: Kinetic model of ATP turnover predicts light-absorption phenotype of purple bacteria.
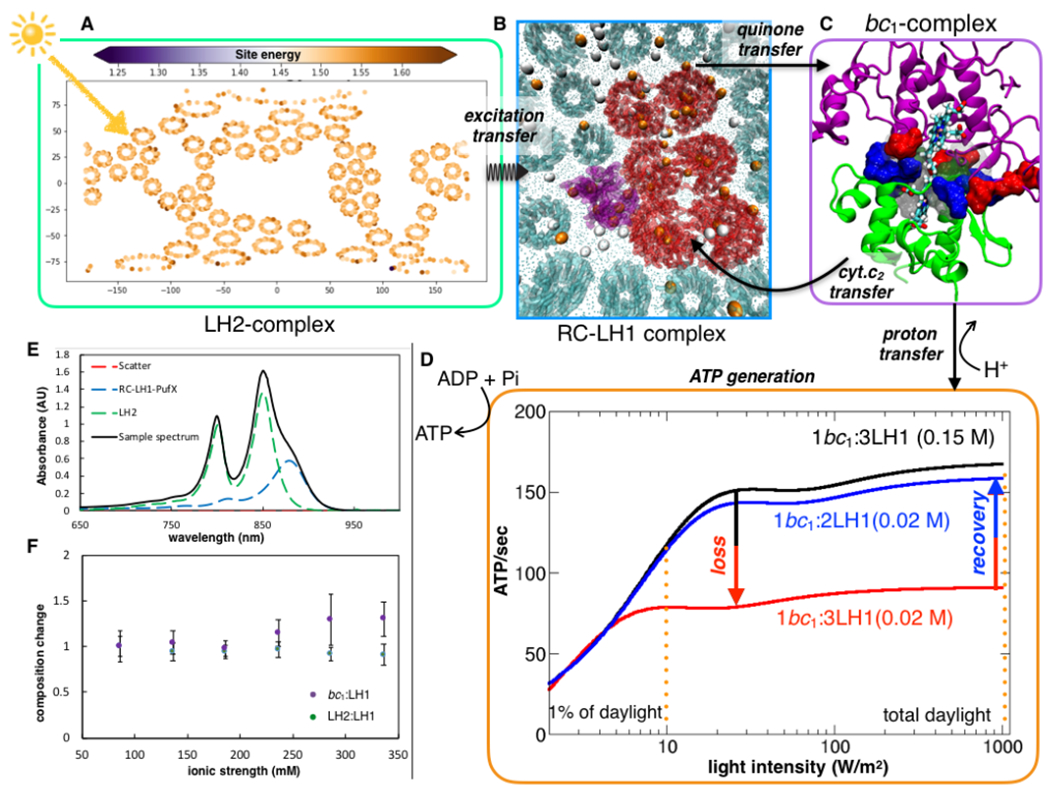
(A) Influence of environment on average excitation energies of the Bacteriochlorophyll-B 800 pigments. The variation in the average excitation energies of B800 among the different LH2 rings due to the thermal disorder captured by the MD simulation mapped spatially using a 2D-Mollweide projection. (B) Following excitation transfer, charge-separation at RC-LH1 releases electrons, which charge-carrier quinone molecules transfer to the bc1 complex. Membrane-wide view of swimming (white) and diving (orange) quinone molecules illustrate that the former is more probable away from the protein-lipid interface, while the latter is significant close to the protein networks. The diving quinones stabilized by the positive electrostatic potential in the vicinity of the proteins (Fig. S25). (C) Closing the electron-chain, a second carrier, cyt. c2, binds to the bc1, abstracts an electron, and diffuses back to RC-LH1. (D) Oxidation of the reduced quinone by bc1 is accompanied by an accumulation of the proton motive force, driving ATP synthesis. ATP production rate is presented as a function of incident sunlight intensity, showing saturation under low-light conditions. At low salt strengths, enhancement of cyt. c2 turnover times, reduces ATP production rate by 2-fold. The model indicates an increment in ATP production when the bc1: LH1 composition changes from 1:3 to 1:2. (E) Spectroscopic results indicate the change in LH2:LH1 and bc1:LH1 ratio with respect to that at the physiological 0.15 M salt concentration is minimal for salinity range between 0.10 and 0.35 M (F), indicating a robust architecture for energy conversion across these conditions. At 0.15 M the LH2:LH1 is 1:2.6 and bc1:LH1 is 1:3.