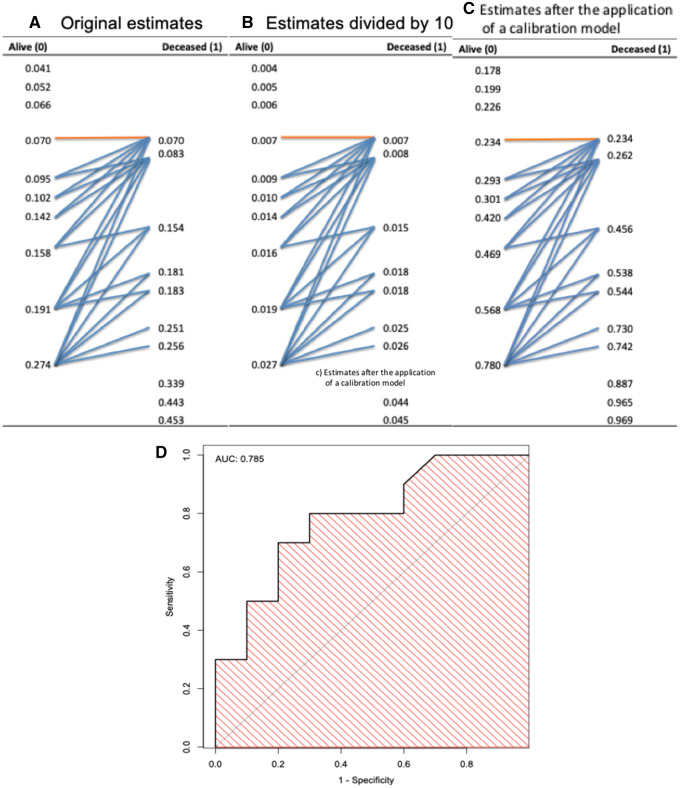
Figure 1.
Illustration of a receiver-operating characteristic curve and corresponding area under the receiver-operating characteristic curve (AUC) derived from predictive model estimates. (A) Original estimates. (B) Original estimates divided by 10. (C) Original estimates after the application of a calibration model to have the estimates be closer to the actual outcomes. The blue arrows, showing discordant pairs, indicate pairs of estimates in which the estimates for the Alive patients (coded as 0) are greater than the estimates for the Deceased patients (coded as 1), while the orange arrows indicate pairs of estimates where estimates for Alive and Deceased patients are equal (ties). The AUC is equivalent to the concordance index, which can be calculated here by the number of concordant pairs (ie, total number of pairs minus the discordant and half of the tied pairs) over the total number of pairs, shown in the text as equation 1. (D) Identical receiver-operating characteristic curve and AUC (0.785) for the 3 models.

