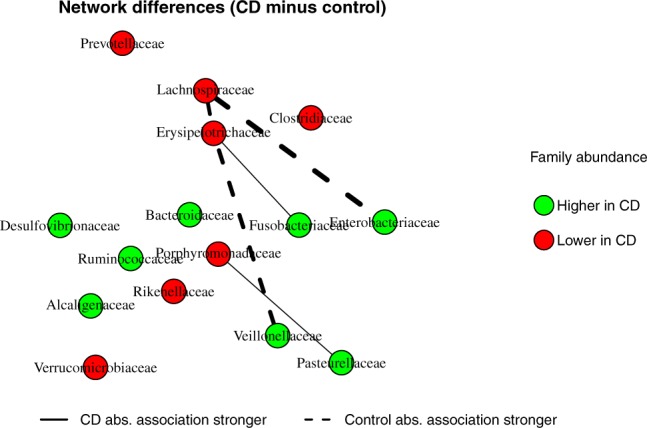
Fig. 5.

Network differences between Crohn’s and control samples. An edge is shown when the co-occurrence between a pair of taxa differs significantly between the two groups based on the 90% credible interval. Colors show whether family abundance is higher in Crohn’s or in control samples. (Color version of this figure is available at Bioinformatics online.)
