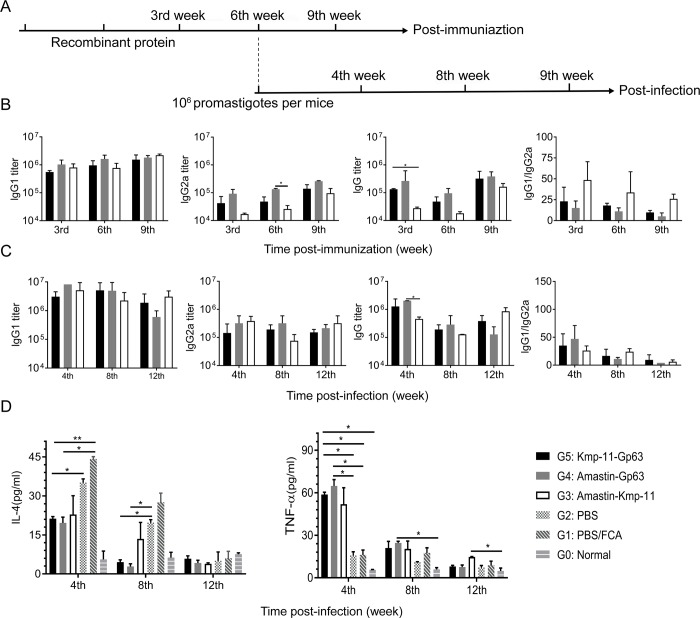
Fig 3. Immunization and challenge schedule, IgG titers and cytokine levels.
(A) Three weeks after DNA intramuscular injection, protein boosted immunization was carried out. Mice were sacrificed for immune analysis at 3rd, 6th and 9th week post-immunization. In addition, infections were performed, and mice were euthanized for immune analysis at 4th 8th and 12th week post-infection. (B, C) Post-immunization or post-infection IgG, IgG1 and IgG2a antibody titers were measured by ELISA, and the values of IgG1/IgG2a were calculated as well. (D) Post-infection cytokines, IL-4 and TNF-α, were determined by ELISA. The data were presented as mean ± SD. Statistical analyses were performed by IBM SPSS Statistics 22 with one-way analysis of variance, and the significant difference was designed as asterisks (*P<0.05, **P<0.01,***P<0.001).

