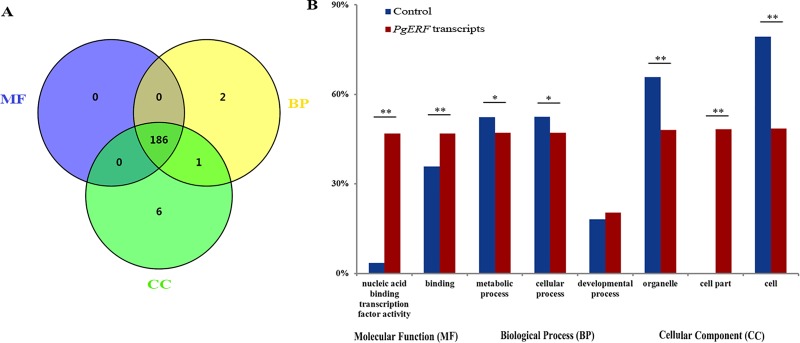
Fig 3. Functional categorization of the AP2/ERF gene family in ginseng.
(A) Venn diagram of the PgERF gene transcripts categorized into three primary categories, biological process (BP), molecular function (MF) and cellular component (CC). (B) The subcategories of the PgERF gene transcripts (Level 2). The enrichment of the PgERF gene transcripts in each subcategory was calculated using all the gene transcripts of ginseng as the background control. A single asterisk “*” indicates the significant difference of the number of PgERF gene transcripts categorized into the subcategory from that of all the gene transcripts of ginseng at P ≤ 0.05, while double asterisks “**” indicate the difference at a significance level of P ≤ 0.01.

