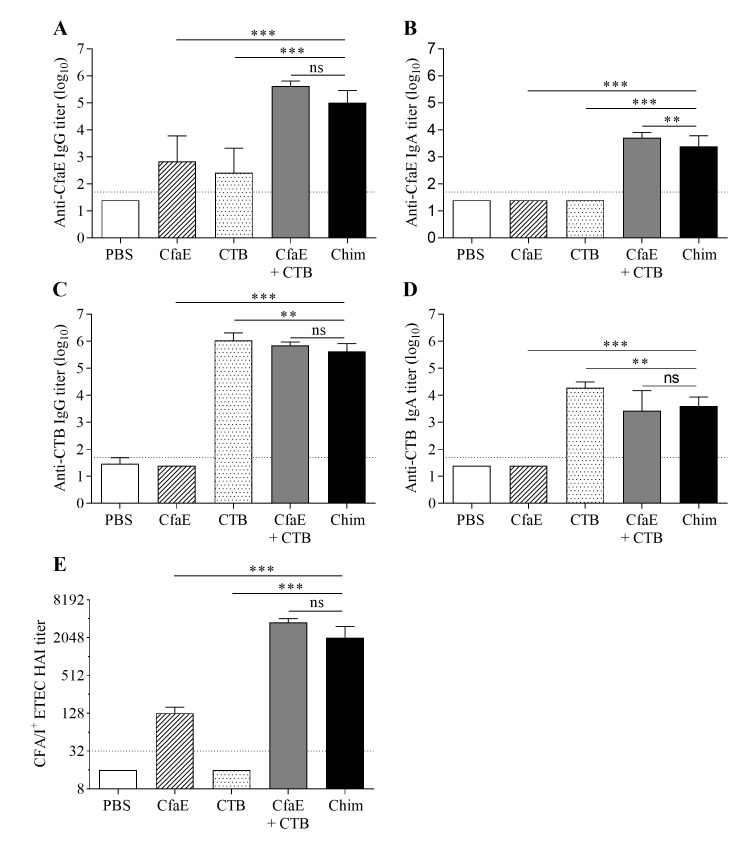
Fig 4. Intranasal immunization with dscCfaE-CTA2/CTB chimera (Chim).
Serum antibody responses on day 42 in BALB/c mice vaccinated IN with 65 μg dscCfaE-CTA2/CTB (black bars), 25 μg CfaE + 36.5 μg CTB (grey bars), 36.5 μg CTB (stippled bars), 25 μg CfaE (striped bars), or PBS (white bars). (A) Anti-CfaE IgG, (B) anti-CfaE IgA, (C) anti-CTB IgG and (D) anti-CTB IgA end point ELISA titers are shown as mean log10 titers ± SD. The horizontal lines (1.7) denote the lowest dilution tested. (E) Functional antibody titers are shown, as measured by the HAI assay using CFA/I-ETEC (H10407) and red blood cells. Data are represented as the median and interquartile ranges of data from each group and the horizontal dotted line (1:32) denotes the lowest dilution of serum tested. For A-E, statistical significance was determined by using one-way ANOVA and Tukey’s multiple comparisons test. Asterisks denote a significant difference between responses in the indicated groups (*P<0.05; **P<0.01; ***P<0.001; not significant (ns) P>0.05).

