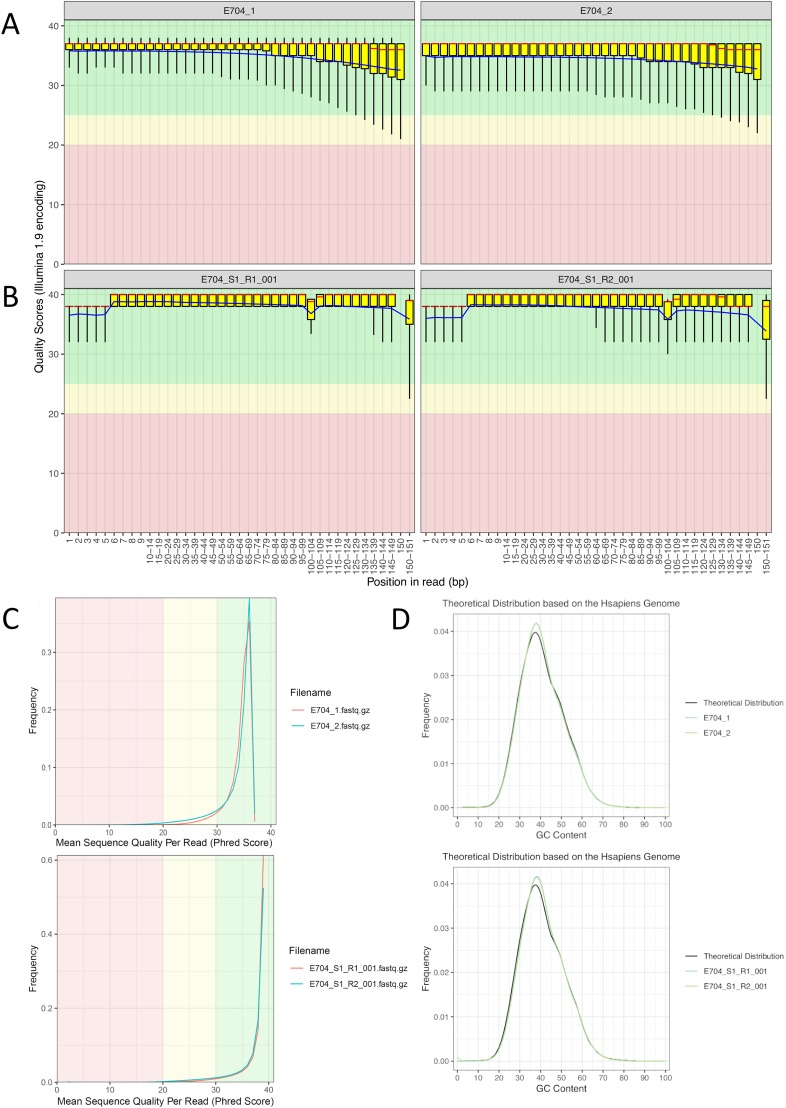
Fig 1. Post-filtering data quality control.
(A), (B) Distribution of nucleotide quality parameters across reads. The presented data is for both MGISEQ-2000 (A) and HiSeq 2500 (B) platforms for forward (R1) and reverse (R2) reads, respectively. For each position in the reads, the quality scores of all reads were used to calculate the mean, median, and quantile values; therefore, the box plot can be shown. Overall quality score distribution for MGISEQ-2000 and HiSeq 2500 data (C). Distribution GC-content in the data generated by MGISEQ-2000 and HiSeq 2500 (D). FastQC [15] was used for the analysis.

