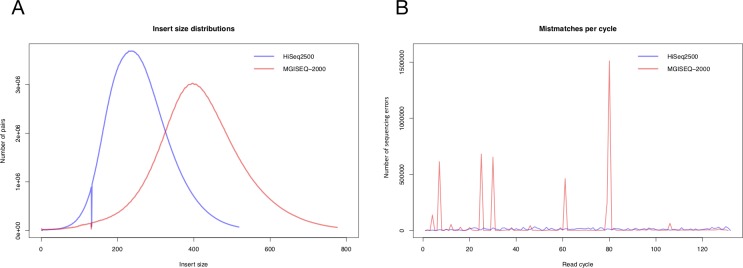
Fig 3. The results of the QC analysis of read alignment to the reference genome.
(A) The distribution of insert length values between reads of the E704-I library (blue line) and the E704-M library (red line). (B) The number of random errors for HiSeq 2500 (blue line) and MGISEQ-2000 (red line). The alignment algorithm used is BWA-MEM [19]. QC analysis was performed using bamstats [20, 21].

