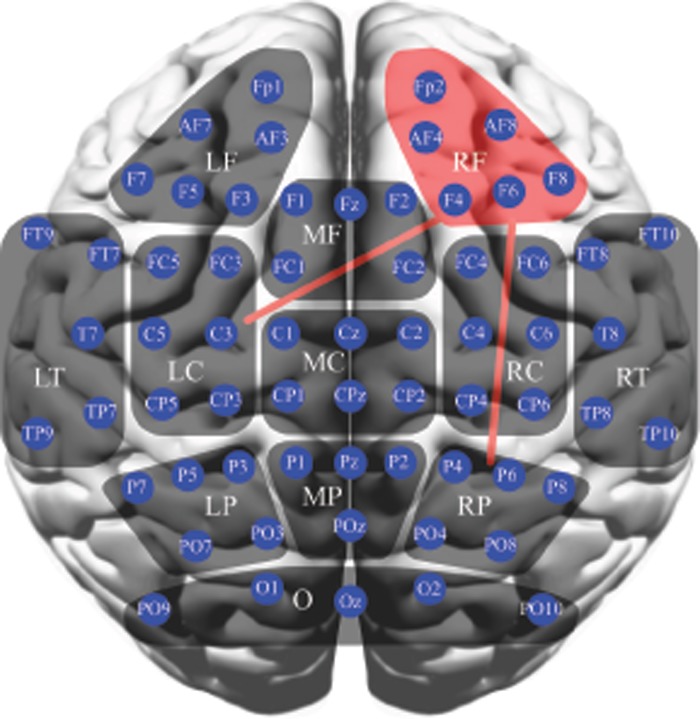
Fig 2. Schematic illustration of statistical analyses for regional average PLI (non-parametric permutation test; the significant difference is indicated by red region) and regional PLI (non-parametric permutation test; the significant difference is indicated by red line) in the delta band.
The regional average PLI significantly decreased over the right frontal region in MCI patients. Also, the regional PLI significantly decreased between the right frontal and left central, and between right frontal and right parietal regions.

