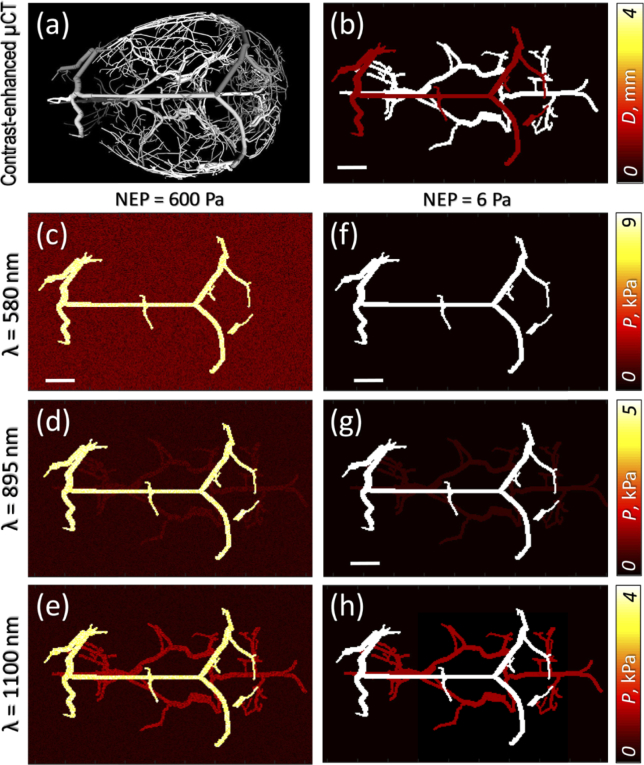
Fig. 5.
Numerical simulation of OA imaging of murine cerebral vasculature. (a) Segmented vasculature from contrast-enhanced μCT angiography [32]. (b) Vascular network consisting of two plexuses that was employed for simulations. (c-h) Simulated OA images corresponding to the laser wavelengths of 580 nm (c,f), 895 nm (d,g) and 1100 nm (e,h) and different ultrasound detector sensitivities (maximal intensity projections are shown).

