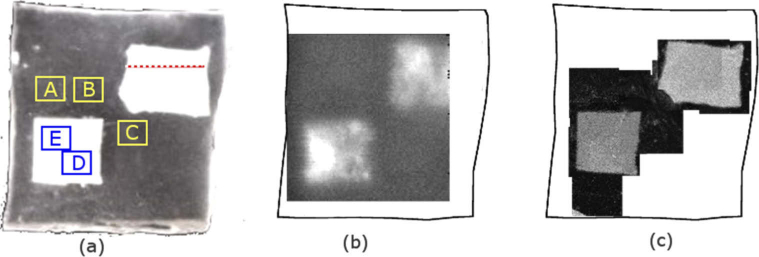
Fig. 1.
(a) Photograph of the front surface of the silicone main test object. The white areas are the embedded highly-scattering silicone-TiO2 contrast objects. Areas A, B and C were the locations where the depth of the silicone back interface was calculated and represent the full thickness of the test object. Areas D and E were the locations where the depth of the embedded square was calculated. The red dotted line represents the profile region along which the depth profile of the rectangle was calculated. (b) An en-face THz image, which takes the absolute value of the integral of the reflected THz pulse over a time range of 12 ps for each time-domain waveform and assigns that value to the pixel to form the 2D image and (c) several of the OCT en-face images manually stitched together. The image property used for each pixel in the OCT image was the maximum of the log intensity of the signal returned from the embedded objects.

